Curated OER
Regrouping Ten Ones for One Ten
Students explore regrouping. In this hands-on math place value lesson, students construct models using connecting cubes and place value mats to solve simple addition problems that require regrouping.
Curated OER
Measurement: Perimeter and Area
In this perimeter and area lesson, students learn the formulas for perimeter and area and view model problems using tiles. Students work in groups to solve practice problems. Students define perimeter and area and explain why it is...
Curated OER
Usage and Interpretation of Graphs
Students explore graphing. In this graphing lesson, students predict how many shoe eyelets are present in the classroom. Students count eyelets and work in groups to organize and chart the data collected. Students put all the data...
Curated OER
Burial Ground
Students visit the burial ground at Huguenot Street and work in groups to calculate the average lifespan for a resident in the 1700's and one in the 1800's. They analyze the grave markers for further information.
Virginia Department of Education
Factoring for Zeros
Relate factors to zeros and x-intercepts. Scholars first graph quadratics in both standard and factored forms to see that they are the same. They go on to use the graphs to see the relationship between factors and x-intercepts.
Virginia Department of Education
Transformation Investigation
Graph it! Investigate transformations with a graphing calculator. Pupils graph sets of linear functions on the same set of axes. They determine how changes in the equation of a linear function result in changes in the graph.
Teach Engineering
Working Together to Live Together
Whose home is it anyway? Design teams plan a housing development in which they must also protect a native species. The teams consist of a project manager, civil engineer, environmental engineer, and graphic designer. Teams present their...
EngageNY
Projecting a 3-D Object onto a 2-D Plane
Teach how graphic designers can use mathematics to represent three-dimensional movement on a two-dimensional television surface. Pupils use matrices, vectors, and transformations to model rotational movement. Their exploration involves...
Kenan Fellows
Reading Airline Maintenance Graphs
Airline mechanics must be precise, or the consequences could be deadly. Their target ranges alter with changes in temperature and pressure. When preparing an airplane for flight, you must read a maintenance graph. The second lesson of...
EngageNY
Relationships Between Two Numerical Variables
Working in small groups and in pairs, classmates build an understanding of what types of relationships can be used to model individual scatter plots. The nonlinear scatter plots in this lesson on relationships between two numerical...
EngageNY
Word Problems Leading to Rational Equations
Show learners how to apply rational equations to the real world. Learners solve problems such as those involving averages and dilution. They write equations to model the situation and then solve them to answer the question — great...
EngageNY
A Surprising Boost from Geometry
Working with imaginary numbers — this is where it gets complex! After exploring the graph of complex numbers, learners simplify them using addition, subtraction, and multiplication.
EngageNY
Comparing Linear and Exponential Models Again
Making connections between a function, table, graph, and context is an essential skill in mathematics. Focused on comparing linear and exponential relationships in all these aspects, this resource equips pupils to recognize and interpret...
EngageNY
Recursive Formulas for Sequences
Provide Algebra I learners with a logical approach to making connections between the types of sequences and formulas with a instructional activity that uses what class members know about explicit formulas to develop an understanding of...
EngageNY
Distance and Complex Numbers 2
Classmates apply midpoint concepts by leapfrogging around the complex plane. The 12th lesson plan in a 32 segment unit, asks pupils to apply distances and midpoints in relationship to two complex numbers. The class develops a formula to...
EngageNY
Graphing Quadratic Functions from the Standard Form
Use context to explain the importance of the key features of a graph. When context is introduced, the domain and range have meaning, which enhances understanding. Pupils use application questions to explore the key features of the graph...
EngageNY
Transformations of the Quadratic Parent Function
Efficiently graph a quadratic function using transformations! Pupils graph quadratic equations by completing the square to determine the transformations. They locate the vertex and determine more points from a stretch or shrink and...
Kenan Fellows
Algebra I Review, Solving for Unknown Variable
Many high school science courses rely on mastery of algebra skills. In an integrated chemistry and Algebra II activity scholars review solving equations for a specified variable with a worksheet. They use common chemistry equations to...
Statistics Education Web
Now You SeeIt, Now You Don't: Using SeeIt to Compare Stacked Dotplots to Boxplots
How does your data stack up? A hands-on activity asks pupils to collect a set of data by measuring their right-hand reach. Your classes then analyze their data using a free online software program and make conclusions as to the...
Education Development Center
Interpreting Statistical Measures—Class Scores
Explore the effect of outliers through an analysis of mean, median, and standard deviation. Your classes examine and compare these measures for two groups. They must make sense of a group that has a higher mean but lower median compared...
Education Development Center
Consecutive Sums
Evaluate patterns of numbers through an engaging task. Scholars work collaboratively to determine a general rule reflecting the sum of consecutive positive integers. Multiple patterns emerge as learners explore different arrangements.
Achieve
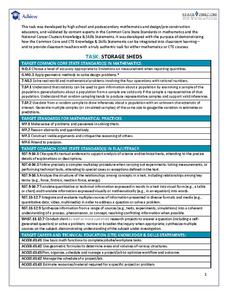
Task: Storage Sheds
Bridge the gap between mathematics and Career Technical Education. Pupils research the cost associated with building storage sheds and analyze possible profit. They build scale models and determine if building and selling the sheds is a...
Achieve
Corn and Oats
How much land does a parcel hold? How much fertilizer does it take for a field of corn? Pupils answer these questions and more as they apply ratio reasoning and unit analysis.
Noyce Foundation
Cut It Out
Explore the mathematics of the paper snowflake! During the five lessons progressing in complexity from K through 12, pupils use spatial geometry to make predictions. Scholars consider a folded piece of paper with shapes cut out. They...


