Curated OER
What Goes Up Must Come Down!!
Fifth graders look at actual sunrise and sunset times for their hometown to determine a pattern in the amount of daylight. They collect their data in Excel and create a chart to help them identify the pattern, then write an explanation...
Curated OER
Bringing Climate Change Into the Classroom
Students investigate the greenhouse effect and examine the potential effects of climate change in the Arctic. They construct a mini-greenhouse and test its effect on temperature, analyze historical climate statistics, and conduct an...
Curated OER
Weather and its Effect on the Environment and Settlement
Young scholars, after choosing two diverse cities, collect data on weather for a month and construct a graph on temperature and precipitation. After collecting population data of said cities, and graphing it, they plot population on a...
Curated OER
Weather Station Report
In this science worksheet, students fill out the data report for the seven different questions. The focus is upon the interpretation of data.
Curated OER
Weather Watchers
Students are introduced to an Underground Weather Stations. In groups, they use the internet to research the weather in different parts of the United States locating each city. To end the lesson, they summarize the information they...
Center Science Education
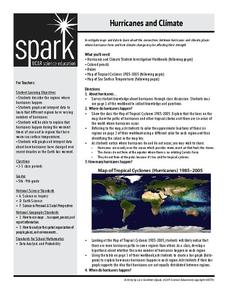
Hurricanes and Climate
Feeling under the weather? This lesson plan on hurricanes can whip things up! With professionally designed maps and handouts, teach your future weathermen (or women) where, when, and how hurricanes occur. They identify hurricane regions...
Curated OER
Air Pollution:What's the Solution?-Weather's Role
In this air pollution and weather instructional activity, students collect data using an online animation to determine the air quality at given times along with the wind speed and temperature in a particular city. Students make 3 bar...
Curated OER
Weather Forecasting
Fourth graders explore the concepts of weather forecasting. Students locate the current weather in a specified city. In groups, they record the specified weather information and make predictions of weather. Students justify their...
Curated OER
Weather Tracking
Second graders use the internet to locate weather reports. They present data collected to the class through poster presentation. They read aloud the book Cloudy with a Chance of Meatballs by Judi Barrett and answer questions about...
Curated OER
Meet the Weather Scientist
Fourth graders collect, record and analyze data using simple weather instruments or use weather resources to comprehend weather. They comprehend that scientists are very important people in today's world. Pupils look at cloud types to...
Curated OER
How Much Water Is Available In The Atmosphere For Precipitation?
Students explore the relationship between the available water in the atmosphere and how it is portrayed on satellites. After examining global moisture and precipitation students research precipitation data graph the results. Using their...
Curated OER
Weather Instrument Data Chart
In this science worksheet, students look for the answers to the correct place on the data chart. They organize and make interpretations of the data.
Curated OER
Collect the Weather Lesson Plan
Students explore the weather. In this weather spreadsheet activity, students keep track of weather patterns as they use instruments and resources to chart the data the collect in spreadsheet form.
Curated OER
Effects of Temperature, Deviation on Climate
Students collect and record data for a given city. They calculate standard deviation of temperature and analyze the impact of climate changes on a city's and culture.
Curated OER
Jumping to Conclusions
Students decide as a class what their data is going to be to graph. In this math lesson, students organize data so that it will be easier to display in a graph. Students are guided through the process by their teachers, and helped with...
Curated OER
Our Desert Backyard
Students make observations of their own backyard. In this environment lesson, students keep records of the plants and animals they see in their home or school yard. Students make notes of how the weather and environment changes over...
Curated OER
Sky Observations Sky & Cloud Windows
Students observe the sky and weather to gather data. They conduct experiments to answer questions about the sky and weather phenomena. They measure, analyze and present data. They create sky windows by gluing sky colored paint chips...
Curated OER
Water in the Atmosphere
A slide show serves as the backdrop for a lesson on the moisture in Earth's atmosphere. Through it, mini meteorologists learn about the attributes of the atmosphere and actually use data-collecting weather tools to make observations and...
Curated OER
Natural Selection
Kids act as scientists and preditors in this short natural selection activity; they collect and analyze data, then apply their new knowledge to real-world examples of natural selection. The layout of the worksheet is easy enough to use...
Curated OER
Temperature Bar Graph
Students explore mean, median and mode. In this math activity, students analyze temperature data and figure the mean, median, and mode of the data. Students graph the data in a bar graph.
Curated OER
Countdown to Disaster
Students discover the potential dangers of weather in their hometown. In this environmental instructional activity, students research Hurricane Hugo and the devastation it caused South Carolina in 1989. Students record...
Curated OER
Bluebirds Project
In this bluebirds project worksheet, students are given directions on completing a project about bluebirds including measurements, scientific method questions, data entry, and more. Students complete 15 exercises.
Curated OER
Probability
Third graders conduct experiment, collect data, predict, record, and discuss outcomes, and analyze data for probability.
Curated OER
"Weather" or Not?
Young scholars complete a three week unit about weather and how it affects our behavior. They read and discuss various books related to weather, conduct an experiment about the tilt of the earth, plan a field trip based on temperature,...


