Illustrative Mathematics
Weather Graph Data
Teaching young mathematicians about collecting and analyzing data allows for a variety of fun and engaging activities. Here, children observe the weather every day for a month, recording their observations in the form of a bar graph....
Office of the New Jersey State Climatologist
Play Ball! – Or Not…Making a Decision Using Weather Data
Should the game go on or not? An engaging lesson asks small groups to make a decision using weather data. After analyzing a map, an updated forecast, and radar information, groups have to decide whether to cancel a baseball game. They...
Teach Engineering
Backyard Weather Station
Challenge young meteorologists to apply their knowledge of weather to build their own weather stations. The resource provides the directions to build a weather station that contains a wind vane, barometer, thermometer, and rain...
Chicago Botanic Garden
Plant Phenology Data Analysis
Beginning in 1851, Thoreau recorded the dates of the first spring blooms in Concord, and this data is helping scientists analyze climate change! The culminating instructional activity in the series of four has pupils graph and analyze...
Curated OER
Student News And Weather Channel
Fabulous! Your 5th graders should love this project. As an ongoing activity throughout the year students use temperature probes to record outside temperature and then document their data using spreadsheets. They use their weather data...
Curated OER
TV Weather Announcers
Elementary schoolers collect and record weather data for their local area using data from newspapers, Web sites, and television reports. The read and record data daily, and groups prepare a presentation on their findings for the entire...
Chicago Botanic Garden
Weather or Not
What is the difference between weather and climate? This is the focus question of a activity that takes a deeper look at how weather data helps determine climate in a region. Using weather and climate cards, students decide...
Captain Planet Foundation
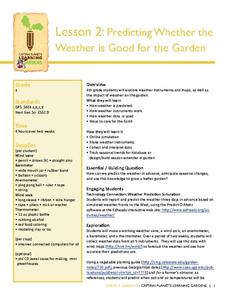
Predicting Whether the Weather is Good for the Garden
Can your class predict the weather? Show them how they can come close with a lesson about creating weather instruments, including weather vanes, barometers, wind socks, anemometers, and thermometers. Kids research weather patterns and...
Curated OER
Air Pollution: What's the Solution?
This air pollution worksheet provides a step-by-step process for gathering data about the ozone and weather. Amateur meteorologists enter data for 3 days including the air quality, the temperature, the wind speed, any particular events...
Curated OER
Adopt a City-Winter Weather
In weather worksheet, students use an on line site to collect weather data. They create 10 different weather scenarios using a temperature and humidity slider. They includethe temperature, relative humidity and weather conditions and...
National Wildlife Federation
Get Your Techno On
Desert regions are hotter for multiple reasons; the lack of vegetation causes the sun's heat to go straight into the surface and the lack of moisture means none of the heat is being transferred into evaporation. This concept, and other...
Curated OER
Weather instruments
Students explore weather instruments. In this weather lesson plan, students make rain gauges, anemometers, and barometers following the instructions given in the lesson plan. Students set up a weather station using their instruments and...
Curated OER
Using Vegetation, Precipitation, and Surface Temperature to Study Climate Zones
Using NASA's Live Access Server, earth scientists compare the temperature, precipitation, and normalized difference vegetation index for four different locations. They use the data to identify the climate zone of each location using...
Montana State University
What's the Weather?
How many jackets do you need to stay warm and climb Mount Everest? An informatie resource covers the topic of Mount Everest, the resource helps young scientists discover the difference between climate and weather. Activities include...
Virginia Department of Education
Weather Patterns and Seasonal Changes
Get your class outside to observe their surroundings with a lesson highlighting weather patterns and seasonal changes. First, learners take a weather walk to survey how the weather affects animals, people, plants, and trees during...
Curated OER
Weather, Data, Graphs and Maps
Students collect data on the weather, graph and analyze it. In this algebra instructional activity, students interpret maps and are able to better plan their days based on the weather reading. They make predictions based on the type of...
PBS
Investigating Seasonal Temperature and Precipitation Variations
Weather seems unpredictable, but is it really? Learners collect weather data from online interactives and build data displays. They use their displays to identify temperature and precipitation patterns in different areas.
Chicago Botanic Garden
Plant Phenology Data Analysis
Studying data over time can paint a pretty interesting picture. Learners use data they collected in the previous lesson to compare to historical data in a similar region. They graph the data of the first bloom of a specific species over...
NASA
Erosion and Landslides
A professional-quality PowerPoint, which includes links to footage of actual landslides in action, opens this moving lesson. Viewers learn what conditions lead to erosion and land giving way. They simulate landslides with a variety of...
Curated OER
Graphing and Analyzing Biome Data
Students explore biome data. In this world geography and weather data analysis lesson, students record data about weather conditions in North Carolina, Las Vegas, and Brazil. Students convert Fahrenheit degrees to Celsius degrees and use...
US Environmental Protection Agency
Weather and Climate: What's the Difference?
Future weather forecasters collect daily temperatures over a period of time. Afterward, they compare their data with monthly averages, as researched on national weather websites, in order to grasp the difference between weather and...
NOAA
How Do We Know?: Make Additional Weather Sensors; Set Up a Home Weather Station
Viewers learn about three different weather measurement tools in installment five of the 10-part Discover Your Changing World series. They build weather vanes to collect data on wind speed, barometers to determine air pressure, and...
Curated OER
Graphing the Forecast-Line Graph or Bar Graph?
Students explore bar and line graphs. In this data collection, graphing, and weather activity, students compare bar and line graphs and discuss which type of graph would be most appropriate for displaying a ten day weather forecast....
Curated OER
Weather Pals
Students study maps of the United States to locate weather pals from a list of schools. They communicate with Weather Pal schools through the use of closed circuit TV. Using weather data collected in their area, they exchange the...


