Federal Reserve Bank
Invest in Yourself
What are the different ways that people can invest in their human capital for a better future? Pupils participate in an engaging hands-on activity and analyze data regarding unemployment, the ability to obtain an education, and median...
West Contra Costa Unified School District
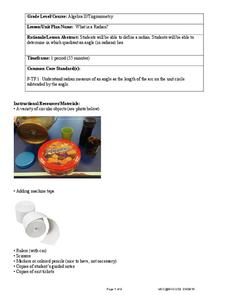
What Is a Radian?
Here's an algebra II activity that strives to make the concept of a radian less abstract and more conceptual. It takes a hands-on approach to exploring the idea of a radian and allows individuals to develop a definition of a...
Curriculum Corner
Area and Perimeter
Get third graders excited to work find area and perimeter of unit squares, rectangles, and irregular shapes. A 36-page packet comes with task cards, graphic organizers, practice worksheets, printables with squares, exit tickets, and word...
Curated OER
BMX Math
Young scholars investigate circles using a BMX path. In this circles lesson, students use technology of various kinds to create a BMX track. They use Moodle to develop their lesson and as they investigate the area and perimeter of a...
EngageNY
Relationships Between Quantities and Reasoning with Equations and Their Graphs
Graphing all kinds of situations in one and two variables is the focus of this detailed unit of daily lessons, teaching notes, and assessments. Learners start with piece-wise functions and work their way through setting up and solving...
EngageNY
Modeling Riverbeds with Polynomials (part 2)
Examine the power of technology while modeling with polynomial functions. Using the website wolfram alpha, learners develop a polynomial function to model the shape of a riverbed. Ultimately, they determine the flow rate through the river.
EngageNY
Modeling from a Sequence
Building upon previous knowledge of sequences, collaborative pairs analyze sequences to determine the type and to make predictions of future terms. The exercises build through arithmetic and geometric sequences before introducing...
EngageNY
Modeling with Polynomials—An Introduction (part 2)
Linear, quadratic, and now cubic functions can model real-life patterns. High schoolers create cubic regression equations to model different scenarios. They then use the regression equations to make predictions.
Mathematics Assessment Project
Solving Linear Equations in Two Variables
Solving problems about pen and paper with systems of equations ... or is it the other way around? In the lesson, learners first interpret expressions and use equations in two variables to solve problems about notebooks and pens. They...
Mathematics Assessment Project
Deducting Relationships: Floodlight Shadows
Try to figure out what happens with shadows as a person moves between two light sources. A formative assessment lesson has individuals work on an assessment task based on similar triangles, then groups them based on their...
Statistics Education Web
Odd or Even? The Addition and Complement Principles of Probability
Odd or even—fifty-fifty chance? Pupils first conduct an experiment rolling a pair of dice to generate data in a probability lesson. It goes on to introduce mutually exclusive and non-mutually exclusive events, and how to use the...
EngageNY
Analyzing a Data Set
Through discussions and journaling, classmates determine methods to associate types of functions with data presented in a table. Small groups then work with examples and exercises to refine their methods and find functions that work...
Intel
Pedal Power
Show your classes the importance of mathematics in something as simple as bicycle design. The final lesson in the six-part STEM series has each group research a different aspect of the bicycle. Learners use mathematical formulas, linear...
EngageNY
Tax, Commissions, Fees, and Other Real-World Percent Problems
Pupils work several real-world problems that use percents in the 11th portion of a 20-part series. The problems contain percents involved with taxes, commissions, discounts, tips, fees, and interest. Scholars use the equations formed for...
EngageNY
Modeling a Context from a Verbal Description (part 2)
I got a different answer, are they both correct? While working through modeling problems interpreting graphs, the question of precision is brought into the discussion. Problems are presented in which a precise answer is needed and...
EngageNY
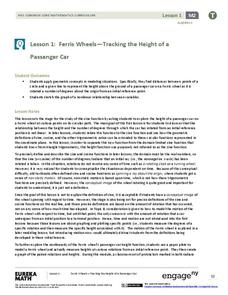
Ferris Wheels—Tracking the Height of a Passenger Car
Watch your pupils go round and round as they explore periodic behavior. Learners graph the height of a Ferris wheel over time. They repeat the process with Ferris wheels of different diameters.
EngageNY
Modeling a Context from Data (part 1)
While creating models from data, pupils make decisions about precision. Exercises are provided that require linear, quadratic, or exponential models based upon the desired precision.
EngageNY
Modeling a Context from Data (part 2)
Forgive me, I regress. Building upon previous modeling activities, the class examines models using the regression function on a graphing calculator. They use the modeling process to interpret the context and to make predictions...
EngageNY
Choosing a Model
There's a function for that! Scholars examine real-world situations to determine which type of function would best model the data in the 23rd installment of a 35-part module. It involves considering the nature of the data in addition to...
EngageNY
Bean Counting
Why do I have to do bean counting if I'm not going to become an accountant? The 24th installment of a 35-part module has the class conducting experiments using beans to collect data. Learners use exponential functions to model this...
EngageNY
Modeling with Quadratic Functions (part 2)
How many points are needed to define a unique parabola? Individuals work with data to answer this question. Ultimately, they determine the quadratic model when given three points. The concept is applied to data from a dropped...
Noyce Foundation
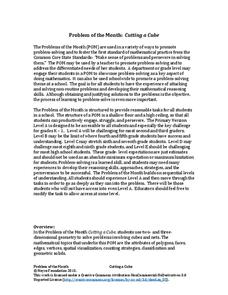
Cutting a Cube
Teach the ins and outs of the cube! A series of five K–12 level activities explore the make-up of the cube. The beginning lessons focus on the vocabulary related to the cube. Later lessons explore the possible nets that describe a cube....
Noyce Foundation
Digging Dinosaurs
Build a function to solve problems rooted in archeology. A comprehensive set of five lessons presents problems requiring individuals to use functions. The initial lesson asks learners to find the possible number of dinosaurs from a...
Noyce Foundation
Measuring Up
Teach the basics of measurement and conversion with a five-lesson resource that builds an understanding of proportion and measurement conversion from elementary through high school. Initially, young scholars use ratios to determine soup...


