EngageNY
How Do 3D Printers Work?
If we stack up all the cross sections of a figure, does it create the figure? Pupils make the connection between the complete set of cross sections and the solid. They then view videos in order to see how 3D printers use Cavalerie's...
EngageNY
Graphs of Simple Nonlinear Functions
Time to move on to nonlinear functions. Scholars create input/output tables and use these to graph simple nonlinear functions. They calculate rates of change to distinguish between linear and nonlinear functions.
EngageNY
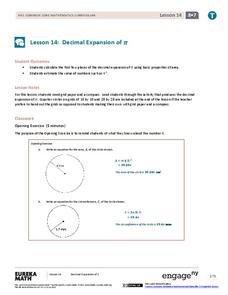
Decimal Expansion of Pi
Develop a better understanding of the value of pi. Learners explore the area of a circle using estimation and graph paper. While continuing to estimate the area of the circle using smaller and smaller grids, the number pi emerges.
EngageNY
Chance Experiments with Outcomes That Are Not Equally Likely
The fifth portion of the 25-part series introduces probabilities calculated from outcomes that are not equally likely. Class members use tables to calculate probabilities of events, add outcome's probabilities, and find...
EngageNY
Triangle Congruency Proofs (part 1)
Can they put it all together? Ninth graders apply what they know about proofs and triangle congruence to complete these proofs. These proofs go beyond the basic triangle congruence proofs and use various properties, theorems, and...
EngageNY
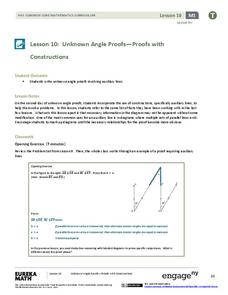
Unknown Angle Proofs—Proofs with Constructions
Provide your emerging mathematicians with the tools to learn as they incorporate auxiliary lines to solve unknown angle proofs in this continuing segment. They decipher information from a diagram to uncover the missing pieces and...
EngageNY
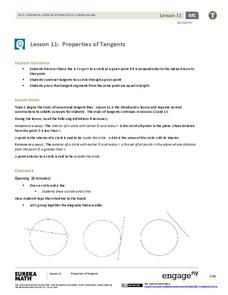
Properties of Tangents
You know about the tangent function, but what are tangent lines to a circle? Learners investigate properties of tangents through constructions. They determine that tangents are perpendicular to the radius at the point of tangency,...
EngageNY
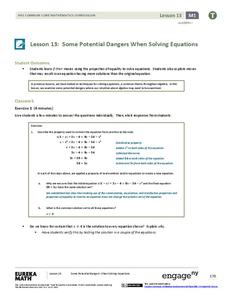
Some Potential Dangers When Solving Equations
Need a less abstract approach to introducing extraneous solutions? This is it! Young mathematicians explore properties used to solve equations and determine which operations maintain the same solutions. They...
EngageNY
The Graph of the Natural Logarithm Function
If two is company and three's a crowd, then what's e? Scholars observe how changes in the base affect the graph of a logarithmic function. They then graph the natural logarithm function and learn that all logarithmic functions can be...
EngageNY
The Mathematics Behind a Structured Savings Plan
Make your money work for you. Future economists learn how to apply sigma notation and how to calculate the sum of a finite geometric series. The skill is essential in determining the future value of a structured savings plan with...
EngageNY
Graphs of Linear Functions and Rate of Change
Discover an important property of linear functions. Learners use the slope formula to calculate the rates of change of linear functions. They find that linear functions have constant rates of change and use this property to determine if...
EngageNY
Multiplication of Numbers in Exponential Form
Develop a solid understanding of multiplication and division properties of exponents. Individuals expand exponential terms to discover the patterns and create the properties in the second installment in a series of 15. The activity...
EngageNY
Classification of Solutions
Is there one, none, or more? Through discussion or activity, scholars find the properties of an equation that will determine the number of solutions. They then use the properties discovered to figure out the number of solutions...
EngageNY
Sequencing Reflections and Translations
Don't get out of order! Examine the effect of order on a sequence of transformations. Learners perform reflections and translation transformations in sequence. They see that changing the order of the transformations does not always have...
EngageNY
Every Line is a Graph of a Linear Equation
Challenge the class to determine the equation of a line. The 21st part in a 33-part series begins with a proof that every line is a graph of a linear equation. Pupils use that information to find the slope-intercept form of the...
EngageNY
Chance Experiments with Equally Likely Outcomes
Take a deeper dive into equally likely probabilities. Pupils build upon their understanding of probability by determining sample spaces and outcomes. Individuals work with sample spaces and determine outcomes that are equally likely....
EngageNY
Conducting a Simulation to Estimate the Probability of an Event II
Add some randomization into simulations. The 11th installment in a series of 25 presents two new methods to use in simulations--colored disks, and random numbers. Pupils use random numbers to run simulations where the probabilities make...
EngageNY
Applying Probability to Make Informed Decisions
Use simulations to determine the probabilities of events to make decisions. Class members are presented with several scenarios, some with known probabilities and others without. Groups run simulations to gather data that they then...
EngageNY
Methods for Selecting a Random Sample
Random sampling is as easy as choosing numbers. Teams use random numbers to create a sample of book lengths from a population of 150 books. The groups continue by developing a technique to create samples to compare from two populations...
EngageNY
Using Sample Data to Compare the Means of Two or More Populations
Determine whether there is a difference between two grades. Teams generate random samples of two grade levels of individuals. Groups use the mean absolute deviation to determine whether there is a meaningful difference between the...
EngageNY
The Relationship Between Visual Fraction Models and Equations
Ours is to wonder why, not just to invert and multiply. The seventh installment of a 21-part module uses fraction models to help pupils understand why the invert-and-multiply strategy for dividing fractions works. They then work on some...
EngageNY
From Ratio Tables, Equations and Double Number Line Diagrams to Plots on the Coordinate Plane
Represent ratios using a variety of methods. Classmates combine the representations of ratios previously learned with the coordinate plane. Using ratio tables, equations, double number lines, and ordered pairs to represent...
EngageNY
The Mean as a Balance Point
It's a balancing act! Pupils balance pennies on a ruler to create a physical representation of a dot plot. The scholars then find the distances of the data points from the balance point, the mean.
EngageNY
Summarizing Bivariate Categorical Data with Relative Frequencies
It is hard to determine whether there is a relationship with the categorical data, because the numbers are so different. Working with a familiar two-way table on super powers, the class determines relative frequencies for each...


