Achieve
BMI Calculations
Obesity is a worldwide concern. Using survey results, learners compare local BMI statistics to celebrity BMI statistics. Scholars create box plots of the data, make observations about the shape and spread of the data, and examine the...
Curated OER
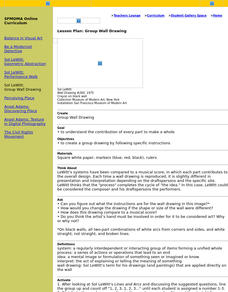
Group Wall Drawing
Students create a group wall drawing that demonstrate the contributions that each part makes to the whole.
Curated OER
Build a Bar Graph
Learners discover how to use bar graphs. They will gather and organize specific data in order to put it into a bar graph. Then they will answer several questions based on the information they have graphed.
Illustrative Mathematics
The Florist Shop
A real-world approach to common multiples asks learners to find different groups of flowers based on their multiples. Useable as a class activity or independent exercise, they will have to organize their thoughts to explain the totals of...
Virginia Department of Education
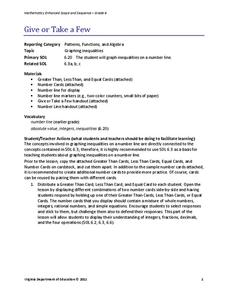
Give or Take a Few
Young mathematicians extend their knowledge of rational numbers on a number line to graph inequalities by first using number cards to compare rational numbers. They finish by using similar reasoning to graph inequalities on a number line.
Discovery Education
Solar System Scale
Extremely large or extremely small numbers are difficult to comprehend. To help understand the massive scale of the solar system, learners complete two activities. First, they create a model to compares the size of the bodies in the...
Curated OER
Exponential Growth versus Polynomial Growth
Your algebra learners explore the values of two types of functions in order to compare growth rates in this short cooperative task. Two types of solutions are given, using a table of values and an abstract argument.
Utah Education Network (UEN)
The Pasture and the Fence
Beginning geometers use tiles and grid paper to draw and calculate perimeter and area. Rectangles of different sizes are created and then measured to build understanding. The one-inch grid sheet referenced is attached.
Inside Mathematics
Party
Thirty at the party won't cost any more than twenty-five. The assessment task provides a scenario for the cost of a party where the initial fee covers a given number of guests. The class determines the cost for specific numbers of guests...
Virginia Department of Education
Box-and-Whisker Plots
The teacher demonstrates how to use a graphing calculator to create box-and-whisker plots and identify critical points. Small groups then create their own plots and analyze them and finish by comparing different sets of data using box...
Illustrative Mathematics
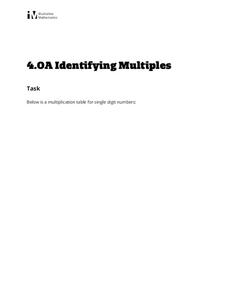
Identifying Multiples
Administer an activity that fosters a child's understanding of multiples. Young mathematicians are guided to complete three tasks on a multiplication chart. Once they color the boxes with multiples of two, three, and four, learners...
North Carolina Department of Public Instruction
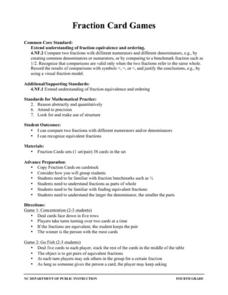
Fraction Card Games
Have fun with fractions in a math card game activity! Cut out the fraction cards and use them to reinforce fraction concepts, including common denominators, parts of a whole, and equivalent fractions.
Foreign Policy Research Institute
Democracy Wall
How free are people in the United States, or in the world for that matter? The class reads and compares two articles that discuss levels of freedom enjoyed by different people around the globe. They discuss why some people have more...
Curated OER
The Adventures of Tom Sawyer: Magic Square Vocabulary
Before getting too far into The Adventures of Tom Sawyer, support your learners by introducing and practicing some vocabulary that might be unfamiliar to them. The vocabulary exercise here includes 16 words from the third and fourth...
Inside Mathematics
Printing Tickets
Determine the better deal. Pupils write the equation for the cost of printing tickets from different printers. They compare the costs graphically and algebraicaly to determine which printer has the best deal based upon the quantity of...
Science Matters
Richter Scale
The 12th lesson in a series of 20 opens with a demonstration of exponential functions using pasta. This concept is connected to the Richter Scale, which is also an exponential function. Scholars compare the exponential scale that...
Curated OER
Cyber Chow Combos
Using a worksheet that's embedded in the plan, elementary schoolers must come up with the most possible combinations of food they can order from the menu on the worksheet. The activity is meant to be done independently by everyone, then...
Curated OER
A Variety of Christmas Activities
For this Christmas worksheet students complete a variety of holiday activities. Students follow directions to color some bells, put holiday events in order, and make a Rudolph head.
Curated OER
Walk-A-Thon
Students graph linear http://www.lessonplanet.com/review?id=180542equations. In this problem solving lesson, students calculate slope and plot ordered pairs on a coordinate grid. Using a real-life example of a walk-a-thon, students...
Curated OER
"Music Be the Food of Love:" Found Poetry with Shakespeare and Hip-Hop
Lines from Shakespeare and from hip-hop artists provide learners with an opportunity to examine the literary devices these artists use to express their ideas about love. Groups use the provided lines to craft found poems, and then the...
Curated OER
Decreasing and Increasing Fractions
Use this math lesson to help your fourth graders further their understanding of ordering fractions. After completing some whole-group activities together as a class, pairs of students play an online game which has them compare fractional...
Illustrative Mathematics
Representing Half of a Circle
Geometric shapes make great visual models for introducing young mathematicians to the concept of fractions. Looking at a series of four circles, students are asked to determine whether or not one half of each circle is shaded. To support...
Illustrative Mathematics
Peaches and Plums
According to the resource graph, which costs more: peaches or plums? Algebra learners compare two proportional relationships and then throw in a banana. Leaving out the scale helps students become intuitive about graphing.
EngageNY
Representing, Naming, and Evaluating Functions (Part 1)
Begin the discussion of domain and range using something familiar. Before introducing numbers, the lesson uses words to explore the idea of input and outputs and addresses the concept of a function along with domain and range.


