NASA
The Effects of Sunspots on Climate
In this sunspots and climate change learning exercise, learners use a diagram of a tree stump and its rings to determine the age of the tree. They use sunspot data from the internet and they construct an Excel spreadsheet to compare the...
Curated OER
Global Climate Lesson Plans
Students explore the concept of global climate. For this global climate lesson, students research and investigate global warming and its effects on the world over the course of 9 lessons. Students create a proposal that show the effects...
Curated OER
Geography, Climate, and Community in the Dominican Republic
Students examine primary source materials on the Dominican Republic in an exploration of how environment influences lifestyles. They compare and contrast life in the Dominican Republic with life in the United States.
Curated OER
Changing Planet: Permafrost Gas Leak
Pair earth scientists up to use an amazing online arctic portal mapping tool and Google Earth to analyze permafrost changes. They compare changes to data on atmospheric concentrations of methane to see if there is a correlation. Then...
Center Science Education
Plugged In To CO2
Watt is going on here? Middle schoolers are learning about energy use and carbon dioxide emissions! In the first part of this lesson, learners measure how much energy different appliances consume and calculate the amount per day. In the...
Consortium for Ocean Science Exploration and Engagement (COSEE)
Ocean Acidification: Whats and Hows
Open this instructional activity by demonstrating the production of acidic carbon dioxide gas by activated yeast. Emerging ecologists then experiment with seashells to discover the effect of ocean acidification on shelled marine...
Curated OER
The Frozen Desert: Graphing and Comparing Climates
Students explore the concept of climate. They use temperature and precipitation data from their area and other regions to construct climate graphs. These graphs are used to help identify factors that influence climate.
NOAA
Climate, Weather…What’s the Difference?: Make an Electronic Temperature Sensor
What's the best way to record temperature over a long period of time? Scholars learn about collection of weather and temperature data by building thermistors in the fourth installment of the 10-part Discover Your Changing World series....
DocsTeach
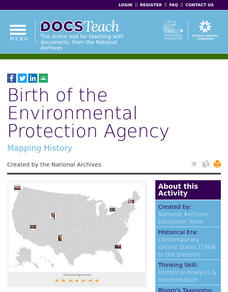
Birth of the Environmental Protection Agency
Seeing is believing when it comes to climate change. An informative activity explores the creation of the Environmental Protection Agency (EPA) and its efforts to document environmental issues with photographs. Academics match images...
Curated OER
Global Warming - The Heat is On: Global Climate Change Revisited
After listening to your lecture on climate change, young scientists access NOAA's database listing Mauna Loa's carbon dioxide data. They graph the monthly means and then compare their graphs to NOAA's. This is a concise plan that could...
Curated OER
Crafting a Fair Climate Agreement
Evaluate the effectiveness of Kyoto Protocol in addressing the issue of global warming. In this global warming lesson, learners compare the pros and cons of the cap-and-trade system versus a carbon tax, as well as other possible...
National Wildlife Federation
Stifling, Oppressive, Sweltering, Oh My!
Looking for a hot date? Pick any day in August, statistically the hottest month in the United States. The 15th lesson in the series of 21 instructs pupils to investigate the August 2007 heat wave through NASA data, daily temperature...
National Wildlife Federation
Conceptualizing Module II - Putting It All Together
"Creativity is just connecting things." - Steve Jobs. After weeks of researching climate change, the ninth lesson in a series of 21 combines the data and analysis to address essential questions. It covers natural phenomenon, human...
National Wildlife Federation
Get Your Techno On
Desert regions are hotter for multiple reasons; the lack of vegetation causes the sun's heat to go straight into the surface and the lack of moisture means none of the heat is being transferred into evaporation. This concept, and other...
National Wildlife Federation
Is It Getting Hot in Here, or Is It Just Me?
Currently, only 2.1% of global warming is felt on continents, while over 93% is felt in the oceans. The fourth lesson in the series of 21 on global warming is composed of three activities that build off one another. In the first...
National Wildlife Federation
Citizen Science to the Rescue!
You don't have to be a scientist or even out of high school to contribute to scientific research. In the 12th instructional activity in the series of 21, scholars use this opportunity to add to the growing body of scientific knowledge...
Curated OER
Glaciers: Then and Now
A large data table is given to your elementary earth scientists in which they record observations that they make while viewing pictures of Alaskan glaciers. They compare and contrast recent photos with older photos. Hold a discussion...
Curated OER
History's Thermometers
Ancient coral beds give scientists clues to past ocean temperatures in much the same way that tree rings indicate historical weather conditions. High school scientists examine coral oxygen isotope ratios and plot the data as a function...
Curated OER
Exploring Regions of Our World
Examine how climate and landforms affect plants and animals that live in particular areas. Discover that these same factors affect peoples' homes, jobs, and recreational activities. Pupils research ecosystems and biomes, and then write...
Curated OER
Is Grandpa Right, Were Winters Colder When He Was a Boy?
Students compare current weather data to historic data to see if there is a temperature change. In this weather lesson students complete a lab activity and determine average changes in temperature, precipitation and cloud cover.
Wild BC
Carbon Sinks and Sources
Earth or environmental science pupils are assigned to be carbon sources or sinks. They ask yes-or-no questions to try to figure out which one they are. Then they discuss ways people can have positive effects on the changing climate by...
Curated OER
The Earth's Atmosphere and Temperature
Students describe and compare the layers of the atmosphere. They explain how to measure the temperature of the atmosphere and discover what causes the atmosphere to heat up in some places more than in others.
Curated OER
The Reason for the Seasons
Students compare graphs of their data that was generated on a NASA website. For this seasons lesson students complete a lab activity.
Curated OER
A Comparison Study of Water Vapor Data to Precipitation over North America
Students use NASA satellite data to compare water vapor over the United States. In this data analysis lesson students use an Excel spreadsheet to map their data.


