Illustrative Mathematics
Peaches and Plums
According to the resource graph, which costs more: peaches or plums? Algebra learners compare two proportional relationships and then throw in a banana. Leaving out the scale helps students become intuitive about graphing.
Achieve
BMI Calculations
Obesity is a worldwide concern. Using survey results, learners compare local BMI statistics to celebrity BMI statistics. Scholars create box plots of the data, make observations about the shape and spread of the data, and examine the...
Curated OER
Chances Are......You're Right
Young mathematicians study probability. In this math lesson plan, learners calculate odds, and convert those into percentages of probability. Fractions are also used, making this lesson plan quite rich in some of the more difficult...
Improving Measurement and Geometry in Elementary Schools
Rep Tiles
In addition to the catchy title, this lesson plan provides upper graders an opportunity to more closely scrutinize the attributes of plane figures. In particular, they focus on the similarity of different shapes. Both whole-class and...
Curated OER
Estimate How Many Seeds Are In a Fruit or Vegetable
Help mathematicians estimate how many seeds are in a given vegetable or fruit. They are divided into pairs and estimate the amount of seeds in a whole fruit without seeing the inside. They then cut the fruit or vegetable in half and...
Curated OER
Introduction to Exponents
Problem solve using exponents. Pupils read One Grain of Rice: A Mathematical Folktale and write powers to represent amounts from the story.They compare actual solutions to their predictions and play a game to practice using exponents.
Illustrative Mathematics
How Long
It won't take young mathematicians long to learn how to measure length with this fun, hands-on activity. Working in pairs, children use Unifix® or snap cubes to measure and record the lengths of different classroom objects. To extend the...
EngageNY
Summarizing Bivariate Categorical Data with Relative Frequencies
It is hard to determine whether there is a relationship with the categorical data, because the numbers are so different. Working with a familiar two-way table on super powers, the class determines relative frequencies for each cell and...
EngageNY
Dilations as Transformations of the Plane
Compare and contrast the four types of transformations through constructions! Individuals are expected to construct the each of the different transformations. Although meant for a review, these examples are excellent for initial...
EngageNY
Trigonometry and the Pythagorean Theorem
Ancient Egyptians sure knew their trigonometry! Pupils learn how the pyramid architects applied right triangle trigonometry. When comparing the Pythagorean theorem to the trigonometric ratios, they learn an important connection that...
Mathematics Assessment Project
Generalizing Patterns: The Difference of Two Squares
After completing an assessment task where they express numbers as the difference of squares (i.e., 9 = 5^2 – 4^2), class members note any patterns that they see in the problems.
EngageNY
Multiplying and Dividing Rational Expressions
Five out of four people have trouble with fractions! After comparing simplifying fractions to simplifying rational expressions, pupils use the same principles to multiply and divide rational expressions.
EngageNY
Construct an Equilateral Triangle (part 1)
Drawing circles isn't the only thing compasses are good for. In this first installment of a 36-part series, high schoolers learn how to draw equilateral triangles by investigating real-world situations, such as finding the location of a...
Kenan Fellows
How Does an Unhealthy Diet Influence our Health and Well-Being?
You are what you eat, or so they say! After surveying family and friends on a week of eating habits, learners analyze the data for patterns. They compare different variables such as fats and cost, fats and calories, or fats and LDLs.
Education World
Putting Turkey on a Table (or a Graph)
Grateful learners put turkey on a table (or a graph)! Through a creative project they show statistical information about turkey population, production, and consumption. A great Thanksgiving lesson plan that can be applied at any time to...
Curated OER
Measurement: 2D and 3D
Students solve volume problems. In this geometry lesson, the class watches a video about clean water (link provided) and individuals compare the volume of different prisms, including an actual drinking glass. Extension activities include...
DK Publishing
3 More Than
Which one has three more? Young mathematicians compare three sets of objects to determine which has three more, checking it off. Then, they practice beginning addition skills by examining sets of candy and adding them up for a total....
Curated OER
Bar Graphs
Introduce scholars to bar graphs and data analysis through analyzing these visual examples. First, they look at a pictograph of fruit types and answer five observation questions. There is one done for them as an example. Learners do the...
Mathematics Assessment Project
Taxi Cabs
A simple real-world problem involving taxi cab fares is used to practice the multplicaiton and division of integers. How many of two different-sized taxis are needed to transport 75 people to the airport? What is the least expensive...
Illustrative Mathematics
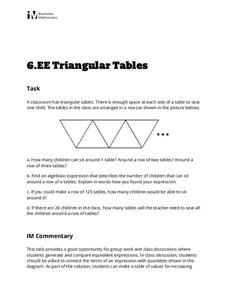
Triangular Tables
Somewhat of a puzzle, this problem gets pre-algebra preteens to write an expression representing a seating chart using triangle-shaped tables. This single task is an applicable lesson for meeting sixth grade Common Core math standards....
Illustrative Mathematics
6.EE.4 Equivalent Expressions
Straight to the point, learners are asked to compare a set of five expressions, determine which are equivalent, and then write equivalent equations for those that do not have any. A benefit is that they will review using properties of...
Illustrative Mathematics
Representing Half of a Circle
Geometric shapes make great visual models for introducing young mathematicians to the concept of fractions. Looking at a series of four circles, students are asked to determine whether or not one half of each circle is shaded. To support...
Balanced Assessment
Disc-Ness
Transform your scholars into mathematicians as they develop their own geometric definition. The task asks individuals to compare cylindrical objects and create a definition for the disc-ness of each object. They may use any method and...
5280 Math
More or Less the Same
Tell the story of the math. Given a graph of a linear system, learners write a story that models the graph before crafting the corresponding functions. Graphs intersect at an estimated point, allowing for different variations in the...


