National Wildlife Federation
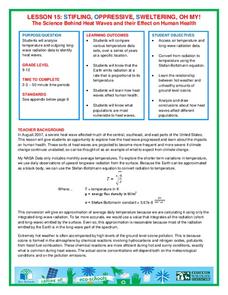
Stifling, Oppressive, Sweltering, Oh My!
Looking for a hot date? Pick any day in August, statistically the hottest month in the United States. The 15th lesson in the series of 21 instructs pupils to investigate the August 2007 heat wave through NASA data, daily temperature...
Curated OER
Mapping Districts
Students use maps to learn about the U.S. Census. In this 2010 Census lesson plan, students visualize census data on maps, use map keys to read population maps, and explore the concept of population density.
Curated OER
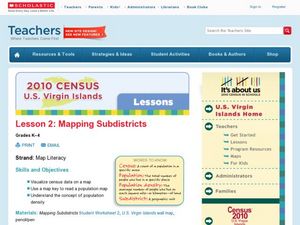
Lesson 2: Mapping Sub-districts
Learners learn more about the census. In this mapping sub-districts lesson plan, students visualize census data on a map, use a map key to read a population map, and better understand the concept of population density.
Curated OER
Postcards from California: A Unit on Geography, Social Studies, History and California's Resources
Fourth graders examine patterns that influence population density in the various regions of California. The unit's three lessons utilize graphic organizers for the interpretation and presentation of data.
Curated OER
Exploring the USA and the World with Cartograms
Learners investigate cartograms in order to explore the different countries on Earth. In this world geography activity, students use the Internet to analyze data on different cartograms. Learners compare data, such as population density,...
Curated OER
Comparing and Ordering Quiz
In this interpreting information using a table worksheet, students read the U.S. Municipalities Census table to answer questions. Students answer 9 questions.
Curated OER
Cities as Transportation Centers
Students work in small groups to identify some of the major transportation centers, recommending two as possible sites for a national political convention, based on population density and the travel networks available in 1835.
Curated OER
Population Dynamics of Growth of Drosophila
Students experiment with Drosophila to determine if density of female flies, food sources, temperature and light affect the population dynamics of growth. Students graph their data and compare their results to the number of human...
Curated OER
Weather and its Effect on the Environment and Settlement
Young scholars, after choosing two diverse cities, collect data on weather for a month and construct a graph on temperature and precipitation. After collecting population data of said cities, and graphing it, they plot population on a...
Curated OER
A Contouring We Go
Students examine the built environment and infrastructures of their community by constructing contour equipment, using the equipment, and comparing their results to current topographical maps of the same area
Curated OER
Internal Spatial Structure of Cities
Young scholars examine the internal spatial structure of cities. In groups, they analyze patterns of functions, structure and characteristics of settlement patterns. They also identify the population densities of land value of business...
Curated OER
Create a Critter Collage
Young scholars create a collage. In this animal classification lesson, students discuss why and how scientists classify animals. Young scholars view pictures of different animals and decide which class each animal belongs to. Students...
Curated OER
The Continent Game
Young scholars order the continents in terms of area, population and other geographic terms.
Curated OER
How Much Is There To Eat?
Tenth graders compare the relationship of food production and population in India with the southern regions of the United States.
Curated OER
Investigating comparative biodiversity of wetland and schoolyard sites
Fourth graders participate in an activity dealing with the environment.
Curated OER
Australia and Argentina: A Study in Contrast
Students study world events and their effect on economic growth. They research and interpret graphs to determine explanations for economic growth. Students compare the World Wars and the Great Depression to the growth of Argentina and...
Curated OER
A Sense of West Virginia
Students consider their perceptions of the world through their 5 senses while visiting the West Virginia State Museum. In this West Virginia history lesson plan, students discover how knowing about the past helps with their understanding...
Curated OER
The Geography of the Philippines
Students examine the geographic features and population distribution of the Philippines. They analyze maps, take a quiz, define monsoon, and discuss how the people in the Philippines have adapted to their environment.
Curated OER
Where We Live
Pupils analyze Canada's population distribution. They access online information to gather demographic information about two Canadian cities. They compare and contrast the quality of life in the two cities and present their findings.
Curated OER
Where Do You Live?
Second graders study and compare rural, suburban, and urban communities. They play a board game, read books about communities, and complete several other activities regarding the different types of communities. Several extension and...
Curated OER
Social Studies: Canadian City Comparison
Students research Canadian population distribution while comparing and contrasting the quality of life in two cities. They discuss issues and problems that cities and rural towns face. Students apply various methods, such as graphs and...
Curated OER
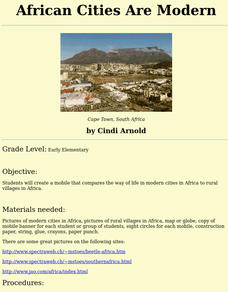
African Cities Are Modern
Students create a mobile that compares the way of life in modern cities in Africa to rural villages in Africa.
Curated OER
Tooling Around Arizona: Reading Arizona Maps
Students study geography. In this Arizona maps activity, students develop their map reading skills. They have class discussions and work independently with various copies of Arizona maps to practice those skills. This activity mentions...
Curated OER
LAND USE ISSUES
Students relate math with real life situations. They identify and plot points on a grid map. They identify and locate the Drop Box Sites.


