Curated OER
Mystery Jars
This is a twist on the old "guess how many jellybeans" game. Using estimation and math skills, learners participate in a fun "mystery jars" activity, trying to make educated guesses at how many objects are in two jars. The basic activity...
Curated OER
How Does Your Garden Grow? Discovering How Weather Patterns Affect Natural Cycles
For the warm-up in this cool climate lesson, you will need to click on "Mapping" and then "US Mapping" once you arrive at NOAA's "US Climate at a Glance" page. Earth science explorers realize that 2012 was a warm winter for us. They read...
Q Continuum
Planets
Have you ever looked up at the night sky and wondered what constellation you were seeing or whether that bright object was a star or a planet? Are you searching for the best tilt-to-view constellation and planet app that money can't buy?...
Computer Science Unplugged
Lightest and Heaviest—Sorting Algorithms
How do computers sort data lists? Using eight unknown weights and a balance scale, groups determine the order of the weights from lightest to heaviest. A second worksheet provides the groups with other methods to order the weights. The...
Nuffield Foundation
Investigating the Effect of Concentration of Blackcurrant Squash on Osmosis in Chipped Potatoes
Model and explore osmosis using squash and potatoes. Young scientists expose chunks of potatoes to different concentrations of a squash solution. They compare the weights of the chunks before and after exposure to the solution and use...
CK-12 Foundation
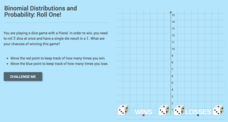
Binomial Distributions and Probability: Roll One!
It takes exactly one to win. Pupils calculate the probability of rolling five dice and having only a single die come up with a one. Learners calculate the number of expected wins out of a series of games. The interactive provides...
Chymist
Ink Analysis: An Experiment in Paper Chromatography
Test differences in writing instruments with this hands-on activity to demonstrate paper chromatography in action. The class performs an experiment on multiple writing instruments and determines the area of separation to discover an...
Discovery Education
Mood Music!
Grouchy? Sad? Here's a great resource that shows kids how music can be used to lift their spirits. Kids collect and chart data on the effects of music on emotions. After analyzing the results of their experiment, they develop their own...
Centers for Disease Control and Prevention
Solve the Outbreak
Pretend to be an Epidemic Intelligence Service officer for the Centers for Disease Control and Prevention. Detectives deal with data and make decisions to determine the dawn of the disease!
Curated OER
Steppin' Out
Students are presented with the question: "Do longer legged people run faster than shorter legged people?" Students conduct an experiment, collect their data, create box and whisker plots using a computer and graphing program, and...
Curated OER
Mean, Median, & Mode
Pupils determine mean, median, and mode. In this problem solving instructional activity, students evaluate a set of data to determine the mean, median, and mode. Pupils work in small groups practicing cooperative learning skills as they...
Curated OER
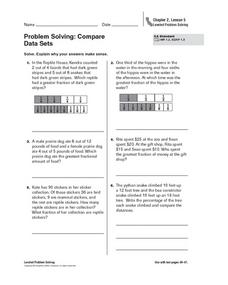
Problem Solving: Compare Data Sets
There are a variety of techniques students can use to compare fractions. In this worksheet on fractions, 5th graders are shown a way to create a visual comparison and asked to solve word problems. Students are encouraged to draw a...
Curated OER
Misleading Graphs
Students explore number relationships by participating in a data collection activity. In this statistics instructional activity, students participate in a role-play activitiy in which they own a scrap material storefront that must...
Curated OER
Exploring the USA and the World with Cartograms
Students investigate cartograms in order to explore the different countries on Earth. In this world geography lesson, students use the Internet to analyze data on different cartograms. Students compare data, such as population density,...
Curated OER
What is a Box and Whisker Plot?
Eighth graders explore the correct use of box and whisker plors. The times when they are appropriate to use to compare data is covered. They plot data according to statistical analysis including mean, median, and mode.
Curated OER
My Peanut Butter is Better Than Yours!
Young scholars explore the concept of statistical data. In this statistical data lesson, students read an article about the dangers of peanut butter to those who are allergic. Young scholars perform a taste test of two different brands...
Curated OER
Seized Before Flights: Graph
In this bar graph worksheet, students analyze a graph that show the number of prohibited items intercepted at U.S. airport screening checkpoints. Students answer 3 problem solving questions about the data on the graph.
Curated OER
Graph It with Coffee!
Students interview employers and employees at local coffee shops about sales and profits and create graphs comparing and contrasting information obtained about the businesses.
Curated OER
Ramp Builder
Students plan and build a ramp designed for maximum distance a car can travel. In this physics and data collection math lesson plan, students work in groups to design a ramp using various household materials. Students test small cars on...
EngageNY
Modeling a Context from Data (part 2)
Forgive me, I regress. Building upon previous modeling activities, the class examines models using the regression function on a graphing calculator. They use the modeling process to interpret the context and to make predictions based...
University of Colorado
Using Spectral Data to Explore Saturn and Titan
Saturn's rings are made of dust, ice, and solid chunks of material. Individuals use spectrographs in this final installment of 22 lessons to determine the atmospheric elements. They analyze spectrums from Titan's atmosphere and Saturn's...
Yummy Math
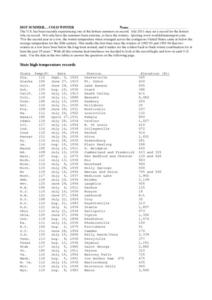
Hot Summer. . . Cold Winter
A table of each state's record temperature reports data that middle schoolers can place on a number line for analysis. A written explanation of how to use this tool and the concept of absolute value are also included. Nine questions are...
Balanced Assessment
Monitor Pricing
Out with the old and in with the new. Learners use a set of prices of computer monitors from 1994 to make a prediction. They then use one current price and what they know about the old prices to make a more recent prediction. Their...
EngageNY
Differences Due to Random Assignment Alone
It takes a lot of planning to achieve a random result! Learners compare results of random assignment, and conclude that random assignment allows results to be attributed to chance. They also realize the set of random means are clustered...


