Curated OER
Slavery: Population Growth in Arkansas
Eighth graders examine the number of slaves in Arkansas in each census period from 1820 to 1860. They graph the data using the proper labeling and write a paragraph summarizing the data from each period making comparisons between slave...
Curated OER
Capture/Recapture
Students use proportions to estimate the size of populations. They describe the data with using a graph or table of the estimate. Students use descriptive statistics to calculate mean, median, and mode. They also compare and contrast an...
Curated OER
Do You See What I See?
Students engage in a instructional activity that differentiates between right and wrong types of observations. In order to conduct the experiment they are provided with leaves and nameless objects with different designs. The two are...
Curated OER
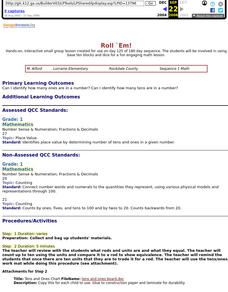
Roll `Em!
First graders engage in using base ten blocks and dice for a fun engaging math lesson. They use a worksheet imbedded in this lesson as the game board to help them play this math game.
Curated OER
BMI: Body Mass Indicator
Students discover their body weight and composition. In this health lesson, students use a body mass indicator to identify their percentage of body fat. Students develop an exercise plan and record progress throughout a month.
Curated OER
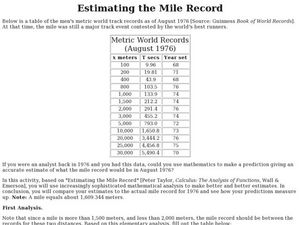
Estimating the Mile Record
In this estimating the mile record, learners examine given data. They use create a box-and-whisker plot to determine the upper and lower quartiles of the data. This one-page worksheet contains 1 multi-step problems.
Curated OER
Exploring Weather Websites
Students research and locate their own weather data using a weather website. They examine how to locate valid information on the www.weather.com website, and explore the website. Next, they select a city they want to visit, and compare...
Curated OER
Compass Designs
Students investigate the properties of two and three dimensional objects. In this geometry lesson, students differentiate polygons based on similarity and congruence. They make observation and interpret the data.
Curated OER
The One in the Middle
Students review and reinforce the concepts of mean, median, and mode based on the number of siblings the students have. They use Post-it notes to organize and re-organize the data.
Curated OER
Make Way for Ducklings
First graders use skills to collect, organize, and interpret data. They compare and contrast two stories, Make Way for Ducklings and Chibi: A True Story From Japan. Students create a duckling.
Curated OER
Statistics with State Names
Students analyze the number of times each letter in the alphabet is used in the names of the states. For this statistics lesson, students create a stem and leaf plot, box and whisker plot and a histogram to analyze their data.
Curated OER
Genetic Drift
Students use a mathematical simulation of genetic drift to answer questions about the factors that influence this evolutionary process. They run a series of simulations varying allele frequency and population size and then analyze their...
Curated OER
Mine Shaft Grade 8 Slope
Eighth graders investigate slopes using real life scenario. In this algebra lesson, 8th graders model and interpret real life data. They plot their data in a coordinate plane and discuss the results with the class.
Curated OER
Analyzing Graphs
In this statistics and probability learning exercise, learners analyze frequency distribution tables or histograms and box and whisker plots. The two page learning exercise contains four multiple choice questions. Answers are included.
Curated OER
Extraction of Caffeine from Tea Leaves
Students conduct an experiment in which they extract the greatest number of grams of caffeine from four bags of tea. They conduct Internet research, conduct the experiment, and record their observations and data.
Curated OER
Fostering Geospatial Thinking: Space to Earth: Earth to Space (SEES)
Students locate and access data to help them with their science inquiry. In this geographical positioning lesson students evaluate and compare data sets.
Curated OER
Decisions, Decisions, Decisions
Students examine graphs to find the most appropriate for various kinds of data. In this graphing lesson, student create bar, line and circle graphs. Students create graphs electronically and manually interpreting the data.
Curated OER
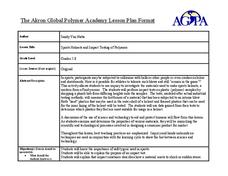
Sports Helmets and Impact Testing of Polymers
Students examine the importance of good quality safety gear. In this investigative activity, students will tests various polymers, collect data, and analyze the data to determine which polymer is best for safety helmets. They will design...
Curated OER
Differences between Climate and Weather
Young scholars collect weather data over weeks, graph temperature data and compare the temperature data collected with averaged climate data where they live.
Texas Instruments
Measure Up!
Statisticians take things to new heights using a set of height measurements. Young scholars use TI-82 or TI-83 calculators to determine extreme values and the median for the data. They also construct a box-and-whisker plot to summarize...
Curated OER
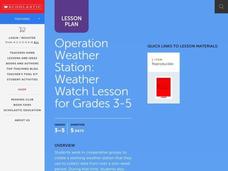
Operation Weather Station
Students work in cooperative groups to create a working weather station. Tkey use the weather station to collect weather data over a one-week period. Students compare the data from their weather station to actual weather information...
Curated OER
What Does Average Look Like?
Fifth graders explore the concepts of range, median, mode, and mean through the use of graphs drawn from models. They use manipulatives to represent data they have collected within their groups, and compare the differences between mode,...
Mathematics TEKS Toolkit
Grade 6: Exploring c/d = pi
Introduce your math class to the perimeter of a circle. Teach them that pi describes the relationship between the circumference and the diameter. As a hands-on investigation, pairs or small groups use string to compare these two values...
Curated OER
Beans and Genes/Genetic Probability
Learners use 2 sets of colored beans to represent the genes of an organism. For this genetic probability lesson plan, students use the colored beans to represent the genotypes of offspring which they pull out of a box at random while the...


