Curated OER
Writing in the Math Classroom
Students determine the vertex, y-intercept and direction of a parabola and write an explanation of how to graph a parabola. They collect and graph data using a calculator.
Curated OER
Mobile vs. Money
Students research the internet and use the information they find to plot straight line graphs. They use graphs to make comparisons of the various packages offered. Students interpret graphs and solve problems based on varying parameters.
Curated OER
Extraneous Solutions
High schoolers find the roots of quadratic equations. In this algebra lesson, students solve radical equations and identify the positive and negative roots. They graph and analyze their functions.
Curated OER
Love Algebra?
Eighth graders, while in the computer lab, access a web site to help them utilize manipulatives of cups and tiles to develop the skills necessary to understand multi-step equations. They assess the relationship between cups and tiles and...
Curated OER
Mental Addition And Subtraction
Sixth graders, while in the computer lab, participate in the game ArithmAttack and complete as many additions and subtraction equations as they can in sixty seconds. They access the web site Mathfrog.com and begin their adventure with...
Curated OER
The Nature and Science of Technology
Fifth graders practice using the scientific method by observing and creating mold. In this bacteria lesson, 5th graders experiment creating their own mold and fungus using petri dishes and oatmeal. Students create an information table...
Virginia Department of Education
Logarithmic Modeling
Explore logarithms and logarithmic regression. Young mathematicians first learn about inverse functions and about the logarithm function family. They take their newfound knowledge to use logarithmic functions to model situations and...
National Wildlife Federation
What is DBH?
When measuring the circumference of a tree, does it matter how high you place the measuring tape? Most scholars have never considered this question, but scientists know that measurement techniques must be standardized. The 13th...
National Wildlife Federation
Stifling, Oppressive, Sweltering, Oh My!
Looking for a hot date? Pick any day in August, statistically the hottest month in the United States. The 15th lesson in the series of 21 instructs pupils to investigate the August 2007 heat wave through NASA data, daily temperature...
Curated OER
Lesson 5: The Quadratic Formula
Students plot quadratic curves to distinguish how different values of a affect a graph. They solve quadratic equations by completing the square. Student's recognize the connection between the roots and the corresponding graph's...
Curated OER
A Century of Challenge and Change: The Filipino American Story
Students recognize the events that led to the Philippine Revolution. In this Philippine Revolution lesson, students relate the causes of the Philippine Revolution to situation in the world today. Students examine the Philippine Equation...
Curated OER
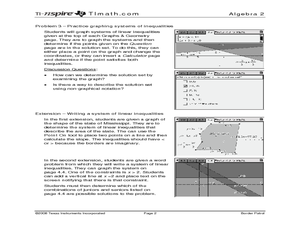
Border Patrol ID: 11603
Incorporate technology in your classroom by teaching your students how to graph systems of linear inequalities as they apply to an area of land. The lesson provides an extension in which students are challenged to write a system of...
Curated OER
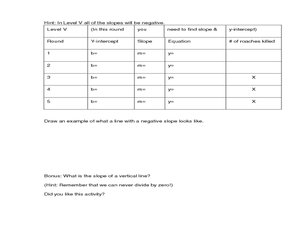
Cockroach Slope
Students identify the slope of linear functions. In this slope lesson, students collect data and graph it. They write equations with no more than two variables and use technology to explain their data.
Curated OER
Oodles of Poodles
Students solve equations by graphing. In this algebra lesson, students differentiate between functions and relations. They use the TI to graph their equation and analyze the graph.
Curated OER
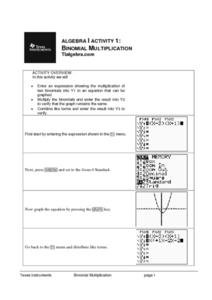
Binomial Multiplication
Learners explore binomial multiplication through the use of technology. Using a graphing calculator, you pupils enter the binomial expression into Y1, multiply the binomials and enter that result into Y2, and combine like terms and enter...
Curated OER
Yeast Fermentation
Students measure the temperature change involved in the production of carbon dioxide by yeast. They also identify products and reactants in a chemical and balance the equation.
Virginia Department of Education
Solution Concentrations
What happens when you combine 6.022 times 10 to the 23 piles of dirt into one? You make a mountain out of a mole hill. Scholars use dehydration to obtain percent composition and then calculate the molarity of the original solution.
EngageNY
Percent Rate of Change
If mathematicians know the secret to compound interest, why aren't more of them rich? Young mathematicians explore compound interest with exponential functions in the twenty-seventh installment of a 35-part module. They calculate future...
Virginia Department of Education
Vapor Pressure and Colligative Properties
Hate to vacuum, but enjoy using a vacuum pump? Explore a lesson plan that starts with a demonstration of boiling water at various temperatures by using a vacuum pump. Then scholars design their own experiments to measure vapor pressure...
Curated OER
Homecoming Tickets
Students solve word problems using systems of equation. In this algebra lesson, students use computer and graphing to graph and analyze their solution. They solve system involving inequalities.
Curated OER
Test On Analytic Geometry/ Play Green Globs
Students engage in a lesson that focuses on analytic geometry. The lesson asked them to apply skills of relating equations when plotting them on the coordinate plane. Students construct the equations using specific criteria and apply them.
Curated OER
Changing the Currency of Different Countries
Seventh graders explore changing currency. In this international math lesson, 7th graders will write and solve 2-step equations in order to convert currencies between nations. Students will research prices of items and currency...
Curated OER
Line of Best Fit
Students calculate the equation of the line of best fit. For this statistics lesson, students create scatter plots and find the line of best fit going through their data. They make predictions and draw conclusions.
Curated OER
Line of Best Fit
Students identify the line of best fit. For this statistics lesson, students collect and analyze data. They calculate the regression equations and identify the different types of correlation.


