Social Media Toolbox
Ethical Decision Making
When faced with a dilemma, how do journalists decide how much news to use? Social media scholars explore the philosophies of ethical resolution in the first of a 16-part Social Media Toolbox series. Partnered pupils use a Potter Box to...
California Academy of Science
What Kind of Geologist Am I?
Transform your class into young geologists as they learn about six different branches of geology. Using the included geology career descriptions and picture cards, learners work in small groups deciding which tools and locations fit...
Code.org
Sending Numbers
Binary graphing ... bit by bit. Pairs work together to develop a protocol in order to send the points of a graph. One partner sends the points and the other receives them and tries to recreate the graph. The pupils use the rubric to...
Social Media Toolbox
Social Media Messages
What are the elements of a good social media post? The 13th activity in the 16-part Social Media Toolbox incorporates all of the typical components found in a Facebook or Twitter post. Scholars work together to create great posts based...
Curated OER
Energy Conservation
Students investigate energy conservation. In this energy conservation and analyzing data instructional activity, students identify and explain several energy sources and research renewable and nonrenewable energy sources. Students use...
Teach Engineering
Designing a Spectroscopy Mission
In this mind-bending activity, young engineers explore this question of whether or not light actually bends. Using holographic diffraction gratings, groups design and build a spectrograph. The groups then move on research a problem...
Code.org
The Need for Addressing
You sunk my battleship via the Internet? Groups of three play a modified game of Battleship using the Internet Simulator. Team members determine how to address messages, so each player knows who the message is for, and refine their text...
Code.org
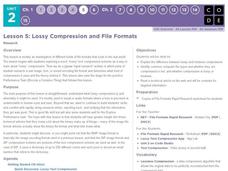
Lossy Compression and File Formats
I'm compressed. Groups do a rapid research of different file types to determine what kind of compression the formats use and how it works. They share their information with the rest of the class until everyone has all the information for...
Code.org
Making Data Visualizations
Relax ... now visualize the data. Introduce pupils to creating charts from a single data set. Using chart tools included in spreadsheet programs class members create data visualizations that display data. The activity encourages...
C-SPAN
Electoral College Pros/Cons and Alternatives
If every vote counts, why do we need the electoral college? Middle and high schoolers study the Constitutional precedent of the electoral college, as well as its place in historical and modern elections, with an engaging social studies...
Kenan Fellows
Reading Airline Maintenance Graphs
Airline mechanics must be precise, or the consequences could be deadly. Their target ranges alter with changes in temperature and pressure. When preparing an airplane for flight, you must read a maintenance graph. The second lesson of...
Scholastic
The First Thanksgiving Feast
Following an online activity, scholars listen to a read-aloud of If You Were at the First Thanksgiving by Anne Kamma. Pupils discuss their family traditions and complete a T-chart comparing the holiday then and now. Collages are made to...
Institute of Electrical and Electronics Engineers
Failure: Seeds of Innovation
"If at first you don't succeed, try, try again!" Through this assignment, emerging engineers examine how failed experiments are simply part of the process of an outstanding design. They begin with some reading about the microwave oven,...
Civil War Trust
Civil War Play
Raise the curtain to a class play that depicts the Civil War through both factual information and literary devices. The performance showcases the Battle of Antietam (Battle of Sharpsburg) and brings attention to women's roles, as well as...
Code.org
Good and Bad Data Visualizations
Good versus bad data. Pairs rate online collections of data representations from good to bad and then suggest ways to improve the visualizations. The class then creates a list of best practices and common errors in data representations...
Code.org
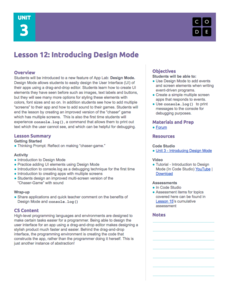
Introducing Design Mode
Move beyond buttons when designing user interfaces. In the fourth installment of a 21-part unit, young computer scientists learn to apply design mode, which gives users options for colors, fonts, etc. They learn to incorporate these...
Code.org
Processing Arrays
Scholars use a playing card activity to help them develop a program to find the minimum value of a list. They learn to use for loops to write code that will process lists.
Code.org
Canvas and Arrays in Apps
Scholars learn how to make a digital canvas and fill it with artwork by creating a drawing app using the canvas element. The activity requires learners to previous knowledge of arrays and return commands to draw images.
Code.org
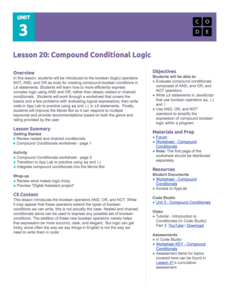
Compound Conditional Logic
Scholars explore compound conditional logic and learn to use the Boolean operators AND, OR, and NOT within conditional statements by incorporating these operators to improve a previously created app.
Code.org
Cracking the Code
Scholars learn how to crack secret codes as they continue reading from the Blown to Bits and try to crack the random substitution cipher. They also begin learning about the Vigenere cipher.
Code.org
Asymmetric Keys – Cups and Beans
Beans are for more than just counting! Introduce public key cryptography with cups and beans and ask scholars to use the beans to send secret numbers. Participants learn how this activity relates to public key cryptography and asymmetric...
Institute of Electrical and Electronics Engineers
Public Keys, One Way Functions and Hard Problems
Use paint to teach about cryptography. Scholars explore public key cryptography by attempting to mix a secret color using paint. After the activity, they investigate the Diffie-Hellman method using prime numbers, exponents, and modular...
Code.org
Number Systems
Generating a system of shapes. Groups work together to create a number system using three different shapes as symbols. The groups should come up with the rules that generate all the possible permutations of the three shapes.
Code.org
Creating Summary Tables
Let the computer summarize all that data. Pairs work together to learn how to create pivot tables by following directions in the online module. They then utilize the data collected from the beginning of the unit to create their own...


