Curated OER
Multiplication Tables Using Microsoft Excel
Eighth graders are introduced to Microsoft Excel as a computer application software program. They create multiplication tables in Microsoft Excel. Students work in small groups. They discuss the $ (anchor) function in Microsoft Excel.
Curated OER
Graphing on the Computer
Students create a bar graph on the computer using given information from the teacher. They create a bar graph using their own information chart (they need to create one on separate paper first). They utilize Microsoft Excel for this lesson.
Curated OER
Technology Resources for the Social Studies Classroom
Looking for ways to increase engagement by bringing technology into your elementary social studies class? Teachers are introduced to the technology resources available for social studies and then they show their students specific...
Earth Watch Institute
Entering Local Groundhog Data in an Excel Spreadsheet
Here is a cross-curricular ecology and technology lesson; your learners create spreadsheets depicting the location and number of groundhog dens in a local park. They research groundhogs and analyze data about where the groundhog...
Curated OER
Excel, Word, and Basketball
Wow, this lesson packs a punch. Pupils interview basketball players, write about a game, and use Excel to organize statistics related to the players and the points scored. Afterward, they create posters, presentations, and much more.
Curated OER
Computer Technology Bingo
Students review new vocabulary from their computer technology class. In groups, they participate in a bingo game in which they define terms from a worksheet. They are assessed based on an attached rubric and discuss any terms they are...
Curated OER
Excel Lesson
Students investigate Microsoft excel. In this technology instructional activity, students create formulas using excel and apply these formulas to solve relative, absolute and mixed reference cells. They perform immediate and delayed...
Curated OER
Basic Algebra and Computers: Spreadsheets, Charts, and Simple Line Graphs
Students, while in the computer lab, assess how to use Microsoft Excel as a "graphing calculator." They view visual representations of line graphs in a Cartesian plane while incorporating basic skills for using Excel productively.
Curated OER
Basic Excel
Students explore basic Excel spreadsheets. In this spreadsheet lesson plan, students enter Alaska weather information and perform calculations. Students title the columns on the spreadsheet and format the cells. Students complete...
Curated OER
Coding History
Students study the topic of codes in Computer Science. They research it history, divisions in the field and its applications. The lesson plan also includes a brief overview of the information technology theory.
West Contra Costa Unified School District
Correlation and Line of Best Fit
Computers are useful for more than just surfing the Internet. Pupils first investigate scatter plots and estimate correlation coefficients. Next, they use Microsoft Excel to create scatter plots and determine correlation coefficients and...
Curated OER
Creating Circle Graphs with Microsoft Excel
Seventh graders will learn how to construct circle graphs using paper and pencil. Then they will learn how to construct circle graphs using Microsoft Excel. This instructional activity uses technology and shows learners how to cross...
Curated OER
Beginning Graphs in MS Excel
Students practice creating graphs in Microsoft Excel. In this technology lesson, students conduct a random survey and collect data. Students use the Microsoft Excel program to create a bar graph of the data.
Curated OER
How to Graph in Excel
Fourth graders construct data graphs on the Microsoft Excel program. In this statistics instructional activity, 4th graders formulate questions and collect data. Students represent their results by using Excel.
Curated OER
Excel for Beginners
In this Excel lesson, learners set a formula to check their homework. Students also use clipart, work in groups, and learn to use the tools in the drop-down list.
Curated OER
Tech Integration Project Lesson Accelerator: Project Overview
Prepare middle schoolers for life in the tech world with a lesson on entering, storing, sorting, and creating database collections. They use a database tool, such as excel, to record the contents of their CD collections. They then...
Curated OER
Tessellations in Excel
Students complete an Excel project on tessellations. In this technology and math lesson, students discuss tessellations and their occurrences in nature. Students use the Excel computer program to create tessellations.
Curated OER
How to keep a timecard in Excel
Students fill out a timecard of family activities in Microsoft Excel. In this Excel lesson plan, students use the program to fill in times they do various activities with their families.
Curated OER
Excel Turns Data Into Information
Learners use excel to analyze data. In this technology lesson, students enter data into the excel program to find averages and organize data.
Curated OER
From Ada to Grace to Sandy - Women Have IT
Explore the significant contributions women have made in the field of information technology with an instructive lesson plan. Through class discussion and research, students discover how women have aided in the growth of the field of...
Curated OER
Don't Settle for a Byte... Get the Megabyte on Technology
Students use word processing, presentation, and spreadsheet software. In this multi-day computer software usage lesson, students complete a research project that requires the use of a word processor, Excel, FrontPage, and PowerPoint to...
Curated OER
Let's Keep Track of Grades
Students participate in a technology project. This lesson is a hands-on spreadsheet project where students are responsible for keeping track of their grades for class. The students learn to enter data into a spreadsheet, create...
Teach Engineering
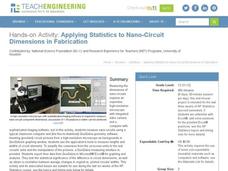
Applying Statistics to Nano-Circuit Dimensions in Fabrication
Do flexible circuits change dimensions during fabrication? Groups use GeoGebra software to measure the length of pictures of flexible nano-circuits. To determine if the circuits change dimensions, future engineers use Microsoft Excel to...
Teach Engineering
Understanding the Air through Data Analysis
Is there a correlation or causation relationship between air pollutants? Groups develop a hypothesis about the daily variation of air pollutants, specifically ozone and CO2. Using Excel to analyze the data, the groups evaluate their...


