Curated OER
Tracking Your Favorite Web Sites
Ninth graders track the hit count on their favorite web sites. In this Algebra I lesson plan, 9th graders record the number of hits on their favorite web site for twenty days. Students explore the data to determine if the relation...
Curated OER
Effective Back-to-School Nights
Here is an engaging and creative project to do with your ESL learners in preparation for back to school night. A digital camera is used to photograph each pupil, and everyone completes a short writing assignment that goes along with...
Curated OER
Using Excel to Draw a Best Fit Line
Students create line graphs for given data in Microsoft Excel. Students follow step by step instructions on how to create their graph, including how to create a trend line. Students print graphs without trend lines and manually draw...
Curated OER
Tasty Tech Activity With Excel
Learners are introduce to basic Excel skills, rank their opinions of menu items from fast food restaurants, add their answers to the spreadsheet, and then create a simple graph of the results.
Curated OER
Building Arrays Using Excel Spreadsheets
Students create arrays using Microsoft Excel. In this technology-based math lesson, students expand their knowledge of multiplication by creating arrays on the computer using a spreadsheet program such as Microsoft Excel.
Code.org
Introduction to Data
Data, data everywhere. Challenge your class to begin thinking about data, the ways people collect information, and what we can learn from this data. Class members discuss sources of data and then individuals answer questions in the class...
Curated OER
Pets Galore!
Fourth graders conduct a class survey on the number of pets that the 4th grade owns and they record that data in their math notebooks. They make a bar graph displaying the results using a spreadsheet through Microsoft Excel.
Curated OER
Technology - Data Collection
Students collect and analyze data from the United States Census Bureau. Using spreadsheet technology, students explore their results and make preductions about income groups. Students compute the mean, median and mode. They create...
Curated OER
Spreadsheet Project: Planning a Party
Learners create a spreadsheet and stay within a budget as they plan a class party for the next holiday.
Curated OER
Fish and Clips
Youngsters test magnetic strength by measuring the mass of paper clips that they "hook" with a magnet. Your first and second graders should love the hands-on activities associated with this plan. The reproducible materials are quite good...
Curated OER
Digital Learning Day and 21st Century Skills
Digital Learning is any instructional practice which uses technology to enhance your students' learning experience
Curated OER
This Little Light of Mine
Elementary schoolers discover how electricity travels and create an electron flow through a closed circuit. They work together to make a closed circuit and observe the electricity being made. This outstanding lesson plan is well worth...
Curated OER
Get My Point!
Here is one of the better lessons I've come across on how to teach fractions and decimals. This lesson plan does a great job of showing how these two mathematical representations of numbers are interrelated. Some excellent websites,...
Curated OER
ABC, Easy as 123
Kindergartners practice identifying the sight and sounds of vowels and consonants. They identify beginning consonants in single-syllable words and print the letters of the alphabet. This outstanding resource has many excellent...
Curated OER
Fill In The GAPP
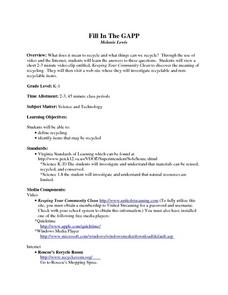
Youngsters discover what recycling is and identify things that can be recycled. They use both video and Internet resources to aid them in their study. This is a well-designed lesson with excellent activities and a nicely-written letter...
Curated OER
Introduction Lesson to the Book Where the Red Fern Grows
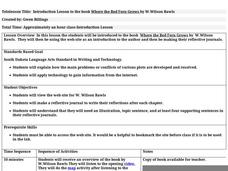
An excellent lesson plan on the classic book, Where the Red Fern Grows. Learners view the W. Wilson Rawls website and engage in a series of activities generated by the website. They write in their reflective journals, watch a video, and...
Curated OER
Current Sources of Energy to Maintain a Sustainable Future
In small groups, fourth graders identify different sources of renewable and non-renewable energy. They research the pros and cons of using each of these resources. They rank household appliances according to energy usage and efficiency....
Curated OER
Exploring Careers
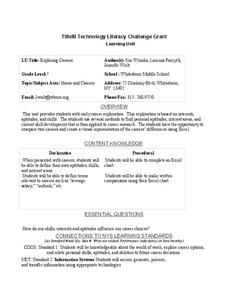
Seventh graders investigate their career aptitudes and interests through a scavenger hunt. They display their choices in Excel spreadsheets.
Space Awareness
Navigation in the Ancient Mediterranean and Beyond
Ancient texts, like Homer's Odyssey, mentions navigating ships by observing constellations. Pupils learn about the link between history and astronomy as they relate to navigation in the Bronze Age. Scholars complete two hands-on...
Curated OER
Food for Thought
Third graders conduct a survey of their class' favorite foods voting on 3-4 favorites overall. They then go to the computer lab and examine how to produce a horizontal bar graph by graphing the favorite foods of the class.
Curated OER
This is the Way We Go To School
Second graders create and utilize a graph using the Excel computer program. They gather data regarding how the students get to school, tally the numbers for the class, and create a bar graph on paper and using Excel.
Curated OER
Intro to PowerPoint-with KidPix Pictures
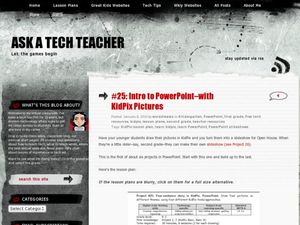
Students construct a four sentence creative story by using KidPix software. In this computer technology activity, students use KidPix software to develop slides about themselves, their family, and their house. Students illustrate each...
Curated OER
Making a Spreadsheet
Students explore spreadsheet software. In this personal finance and computer technology lesson, students develop a vacation spreadsheet on the computer. Students represent hotel, food, transportation, and entertainment costs on a graph...
Curated OER
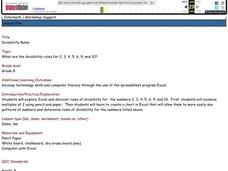
Divisibility Rules
Eighth graders explore Excel and discover rules of divisibility for the numbers 2, 3, 4, 5, 6, 9, and 10; students examine multiples of 2 using pencil/ paper, then create a chart in Excel that will allow them to more easily see patterns...


