Earth Watch Institute
Entering Local Groundhog Data in an Excel Spreadsheet
Here is a cross-curricular ecology and technology lesson; your learners create spreadsheets depicting the location and number of groundhog dens in a local park. They research groundhogs and analyze data about where the groundhog...
Teach Engineering
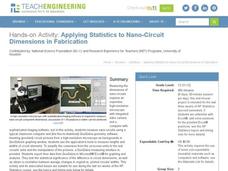
Applying Statistics to Nano-Circuit Dimensions in Fabrication
Do flexible circuits change dimensions during fabrication? Groups use GeoGebra software to measure the length of pictures of flexible nano-circuits. To determine if the circuits change dimensions, future engineers use Microsoft...
Teach Engineering
Understanding the Air through Data Analysis
Is there a correlation or causation relationship between air pollutants? Groups develop a hypothesis about the daily variation of air pollutants, specifically ozone and CO2. Using Excel to analyze the data, the groups evaluate their...
Curated OER
Science-Observation Skill Builders
Pupils explore observation while making connections between observation skills and careers (like how farmers observe the weather). They view a variety of nature photographs on the computer and practice their observation skills by...
Curated OER
Technology that Makes Phonics Fun
Young scholars discover the Internet by participating in on-line educational activities. In this educational technology lesson, students utilize interactive story books, podcasts, and games to help expand an understanding of...
Chicago Botanic Garden
GEEBITT (Global Equilibrium Energy Balance Interactive TinkerToy)
Students use the GEEBITT excel model to explore how global average temperatures are affected by changes in our atmosphere in part two of this series of seven lessons. Working in groups, they discuss, analyze graphs, and enter data to...
Howard Hughes Medical Institute
Spreadsheet Tutorial 1: Formulae, Functions, and Averages
Spread your knowledge of spreadsheets. The first of five tutorials in the Spreadsheet Data Analysis unit introduces the basics of spreadsheets. It shows future data analysts how to organize and format tables, and how to use functions to...
Curated OER
Fish and Clips
Youngsters test magnetic strength by measuring the mass of paper clips that they "hook" with a magnet. Your first and second graders should love the hands-on activities associated with this plan. The reproducible materials are quite good...
Curated OER
This Little Light of Mine
Elementary schoolers discover how electricity travels and create an electron flow through a closed circuit. They work together to make a closed circuit and observe the electricity being made. This outstanding lesson plan is well worth...
Curated OER
Fill In The GAPP
Youngsters discover what recycling is and identify things that can be recycled. They use both video and Internet resources to aid them in their study. This is a well-designed lesson with excellent activities and a nicely-written letter...
Curated OER
Current Sources of Energy to Maintain a Sustainable Future
In small groups, fourth graders identify different sources of renewable and non-renewable energy. They research the pros and cons of using each of these resources. They rank household appliances according to energy usage and efficiency....
Space Awareness
Navigation in the Ancient Mediterranean and Beyond
Ancient texts, like Homer's Odyssey, mentions navigating ships by observing constellations. Pupils learn about the link between history and astronomy as they relate to navigation in the Bronze Age. Scholars complete two hands-on...
Curated OER
A Comparison Study of Water Vapor Data to Precipitation over North America
Students use NASA satellite data to compare water vapor over the United States. For this data analysis lesson students use an Excel spreadsheet to map their data.
Chicago Botanic Garden
Calculating Your Carbon Footprint
Unplugging from technology for one day per week will decrease your carbon footprint—are you up to the challenge? Part two in a series of three allows individuals to explore their personal carbon footprints. By first taking a quiz at home...
Curated OER
Exploring Biomes Lesson 2: Biome Research
Learners view a PowerPoint presentation on biomes and their classifications. Divide them into groups and assign them each an individual biome to research. There are pictures of the PowerPoint slides and notes about what to teach for...
Curated OER
I'm Here, I'm There, I'm Everywhere-I'm Super Spud!
Students generate a computer model of a potato plant. In this potato lesson plan, students study the history of potatoes, the variety of potatoes, the functions of the potato plant parts, and make a potato model on the computer.
Teach Engineering
Using Hooke's Law to Understand Materials
Provide a Hooke for a lesson on elasticity with an activity that has groups investigate a set of springs. They use a set procedure to collect data to calculate the spring constant for each spring using Hooke's Law. The groups...
Jason Learning
Tech in the Cycle
It might not be easy, but it is worth recycling electronics. Small groups determine the percentage of the materials that make up an iPad 2 and display the information in a circle graph. They then research the recycling process for...
Teach Engineering
Creepy Silly Putty
It might be silly to determine the creep rate of putty but groups will enjoy making different formulations of silly putty and playing with them to understand how the different mixtures behave. The second part of the activity has groups...
National Wildlife Federation
I’ve Got the POWER Wind Energy Potential at Your School
The 20th lesson in a 21-part series connects the wind data and expectations of a turbine to whether such devices should be built in your area. Scholars begin with estimating the wind potential at school by using long-term climate...
National Wildlife Federation
Ghost Town
Around 93 percent of the reefs on Australia's Great Barrier Reef have been bleached, and almost one quarter of them are now dead. Scholars research the sea temperatures, especially around the areas with coral reefs, to make connections...
PBS
Stories of Painkiller Addiction: The Cycle of Addiction
Drug addiction, including prescription drug addiction, begins with a reason that's different for every user. High schoolers learn more about the reasons people begin abusing drugs with a set of videos and worksheets that discuss four...
Curated OER
Electronic Hydrology Lesson Plan - Revised
Learners use Excel spreadsheets. They predict time and height of peak flow on river
Curated OER
Farming: It's a Fact!
Students use worksheets, food items, and computer programs to learn about the path of food from the farm to their meals. In this agriculture lesson, students use a provided worksheet to learn facts about farming. They use a bag of...


