Curated OER
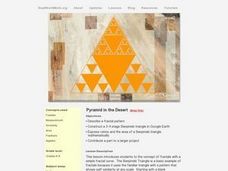
Pyramid in The Desert
Students investigate the Sierpinski triangle and calculate the ratio and area of the triangle. In this fractals instructional activity, students calculate parts of a Sierpincki triangle. They use Google Earth to help them construct the...
Curated OER
Learn How to Graph
Learners examine various types of charts and discover how to construct a line graph. Using graph paper, they construct a graph displaying weight loss over a five-year period. They draw copnclusions from the completed graphs.
Curated OER
Learning About Ratios: A Sandwich Study
Learners gain a concrete introduction to the concept of ratios. They demonstrate the ability to create ratios using peanut butter and jelly. They, in groups, construct 6 different sandwiches using different amounts of each food.
Noyce Foundation
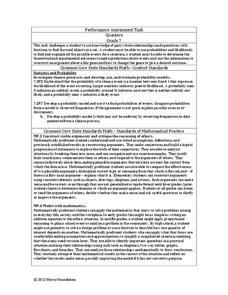
Ducklings
The class gets their mean and median all in a row with an assessment task that uses a population of ducklings to work with data displays and measures of central tendency. Pupils create a frequency chart and calculate the mean and median....
Inside Mathematics
Scatter Diagram
It is positive that how one performs on the first test relates to their performance on the second test. The three-question assessment has class members read and analyze a scatter plot of test scores. They must determine whether...
Inside Mathematics
Archery
Put the better archer in a box. The performance task has pupils compare the performance of two archers using box-and-whisker plots. The resource includes sample responses that are useful in comparing individuals' work to others.
Inside Mathematics
Rhombuses
Just what does it take to show two rhombuses are similar? The assessment task asks pupils to develop an argument to show that given quadrilaterals are rhombuses. Class members also use their knowledge of similar triangles to show two...
Curated OER
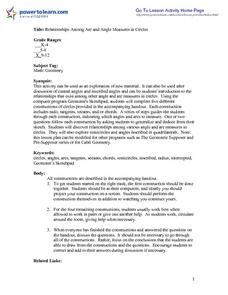
Relationships Among Arc and Angle Measures in Circles
Students follow the directions on the attached worksheet to construct shapes using Geometer's Sketchpad. To start the lesson, it is suggested that the teacher guide the students through the initial problem. When constructions are...
Curated OER
Creating Fractals
Students solve problems using fractals. In this geometry lesson, students identify properties of fractals. They find patterns in their surroundings and relate it to the real world and math.
Inside Mathematics
Quadratic (2006)
Most problems can be solved using more than one method. A worksheet includes just nine questions but many more ways to solve each. Scholars must graph, solve, and justify quadratic problems.
Inside Mathematics
Party
Thirty at the party won't cost any more than twenty-five. The assessment task provides a scenario for the cost of a party where the initial fee covers a given number of guests. The class determines the cost for specific numbers of guests...
Noyce Foundation
Boxes
Teach your class to think outside the box. Scholars use the concept of equality to solve a problem in the assessment task. They determine how to use a scale to identify the one box out of a set of nine boxes that is heavier than the others.
Inside Mathematics
Quadrilaterals
What figure is formed by connecting the midpoints of the sides of a quadrilateral? The geometry assessment task has class members work through the process of determining the figure inscribed in a quadrilateral. Pupils use geometric...
Inside Mathematics
Suzi's Company
The mean might not always be the best representation of the average. The assessment task has individuals determine the measures of center for the salaries of a company. They determine which of the three would be the best representation...
EngageNY
Describing a Distribution Displayed in a Histogram
The shape of the histogram is also relative. Learners calculate relative frequencies from frequency tables and create relative frequency histograms. The scholars compare the histograms made from frequencies to those made from relative...
Noyce Foundation
Counters
For some, probability is a losing proposition. The assessment item requires an understanding of fraction operations, probability, and fair games. Pupils determine the fractional portions of an event. They continue to determine whether...
Curated OER
Exploring Trigonometric Ratios
Learners identify the ratios of trig functions. In this trigonometry lesson, students construct triangles and use it to derive the values of sine, cosine and tangent. They use Cabri software to create the visual of the identities.
Inside Mathematics
Winning Spinners
Winning a spin game is random chance, right? Pupils create a table to determine the sample space of spinning two spinners. Individuals determine the probability of winning a game and then modify the spinners to increase the probability...
EngageNY
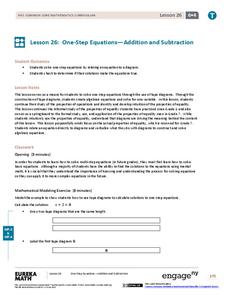
One-Step Equations—Addition and Subtraction
Just one step is all you need to find success in solving equations. The 27th installment in a series of 36 teaches how to solve one-step equations involving addition and subtraction. Tape diagrams help future mathematicians in this task.
Curated OER
Euclidean Geometry
In this Euclidean geometry learning exercise, students use a straight edge and a compass to create constructions that are possible with Euclid's Postulates. This one-page learning exercise contains two construction problems.
Noyce Foundation
Parallelogram
Parallelograms are pairs of triangles all the way around. Pupils measure to determine the area and perimeter of a parallelogram. They then find the area of the tirangles formed by drawing a diagonal of the parallelogram and compare their...
EngageNY
Scatter Plots
Scholars learn to create scatter plots and investigate any relationships that exists between the variables with a lesson that also show them that statistical relationships do not necessarily indicate a cause-and-effect...
EngageNY
One-Step Equations—Multiplication and Division
Discover one more step to being able to solve any one-step equation. Scholars continue their work with one-step equations in the 28th installment of a 36-part module. Tape diagrams and algebraic processes introduce how to solve one-step...
EngageNY
Creating a Histogram
Display data over a larger interval. The fourth segment in a 22-part unit introduces histograms and plotting data within intervals to the class. Pupils create frequency tables with predefined intervals to build histograms. They describe...
Other popular searches
- Building Construction Math
- Construction Math Triangle
- Math on Construction Workers
- Mathematics in Construction
- Stadia Construction Math
- Staid Construction Math


