Rice University
College Algebra
Is there more to college algebra than this? Even though the eBook is designed for a college algebra course, there are several topics that align to Algebra II or Pre-calculus courses. Topics begin with linear equation and inequalities,...
Radford University
Distance and Midpoint Formulas in a Mall
Go for a walk in the mall. Pupils find distances between stores on a diagram of a mall on Quadrant I. The scholars also determine the midpoint between a store and an entrance to the mall to then create their own paths and determine their...
Curated OER
Points on a Line
Get your learners up and moving, all while reviewing numbers on the number line! For this activity, learners are grouped in teams outdoors. The teacher will have already created number lines on the ground (with chalk, tape, etc.), and...
Curated OER
Why Do We Have Seasons?
First graders watch a video about the seasons. They role play with the teacher the sun and earth. The student's heads are the earth, their foreheads are the Northern Hemisphere. The teacher shines a flashlight on them to simulate the sun...
Curated OER
Exponential Growth and Decay
Quiz your middle and high schoolers on solving exponential growth and decay. First, they evaluate for a variable given the second variables value. Then, they graph an equation that illustrates the exponential growth or exponential decay...
Curated OER
Line of Best Fit
In this line of best fit worksheet, students solve and complete 8 different problems that include plotting and creating their own lines of best fit on a graph. First, they study the samples at the top and plot the ordered pairs given on...
CPM
Tables, Equations, and Graphs
Eighth and ninth graders solve and graph 24 different problems that include completing input/output tables and graphing the pairs. First, they find the missing values for each table and write the rule for x. Then, students write the...
Curated OER
Interpret Graphs of Ordered Pairs
Middle and high schoolers solve four word problems based on three different graphs of ordered pairs which show the amount of money spent on lunch on particular days. Next, learners are given two equations of functions, and an x value and...
Curated OER
Clean up the Money!
In this money worksheet, learners fill up a grid with coins and then roll dice to get ordered pairs and take the money of the ordered pair that they roll. Students then add up their money in the end and see who wins.
Curated OER
Earth Science Regents: The Ellipse
Starting with the instructions to draw an ellipse, and with great pictures, this sheet should help your pupils learn the shapes and measurements involved. Using push pins and string, your class can discover the axis and focus points...
Curated OER
Profitable Soda Stand
Am I making any money? Help learners determine if their fictitious soda stand is turning a profit. They graph linear equations using the slope and y-intercept and identify the best price to use to sell soda. They identify the domain and...
Curated OER
World War II
Offering a comprehensive overview of the beginning of World War II, this resource could be a useful addition to a unit on this topic. It could be used as a way to lead a discussion on the war, or as a review tool before a test. Either...
Curated OER
Reading Graphs
Encourage kids to read line graphs with confidence using these examples and accompanying comprehension questions. Learners examine two graphs and answer four questions about each. This is definitely intended for beginners to this type of...
Curated OER
Practice: Word Problems
Congratulations, you've just hit the word problem jackpot! Covering an incredible range of topics from integers and fractions, to percents, geometry, and much more, this collection of worksheets will keep young mathematicians busy...
Curated OER
Performance-Based Assessment Practice Test (Grade 6 Math)
Keep track of your sixth graders' mastery of the Common Core math standards with this practice assessment. Taking a different approach than most standardized tests, this resource includes not only multiple choice questions, but also free...
Mathematics Assessment Project
Sugar Prices
Sugar rush! In this assessment task, learners interpret points on a scatter plot representing price versus weight for bags of sugar. They then determine the bag that represents the best value.
EngageNY
Informal Proofs of Properties of Dilations
Challenge the class to prove that the dilation properties always hold. The lesson develops an informal proof of the properties of dilations through a discussion. Two of the proofs are verified with each class member performing the...
EngageNY
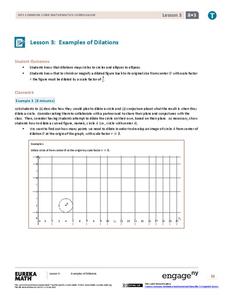
Examples of Dilations
Does it matter how many points to dilate? The resource presents problems of dilating curved figures. Class members find out that not only do they need to dilate several points but the points need to be distributed about the entire curve...
Mathed Up!
Rotation
Two videos show first how to perform a rotation, given the center, the angle, and the direction of rotations. Individuals then see how to find what the rotation is from one figure to another. Pupils practice doing both in seven problems...
CK-12 Foundation
Vector Addition
View vector addition with a greater magnitude. The interactive provides learners with the opportunity to determine the magnitude of vectors and their resultant vectors when added. Pupils investigate the relationship between the...
GeoGebra
Leaping Lizards
Transform lizards onto different locations. The interactive provides a diagram of a lizard and several locations. Pupils use their knowledge of transformations to move the lizard to the different locations and use the tools of GeoGebra...
CK-12 Foundation
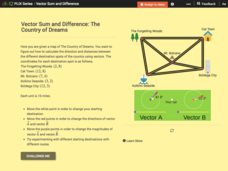
Vector Sum and Difference: The Country of Dreams
Find your way around using vectors. Scholars use an interactive to learn about vector addition. They answer a set of questions about modeling a route on a map using vectors.
Shodor Education Foundation
Scatter Plot
What is the relationship between two variables? Groups work together to gather data on arm spans and height. Using the interactive, learners plot the bivariate data, labeling the axes and the graph. The resource allows scholars to create...
Corbett Maths
Enlargements with Fractional Scale Factors
Enlargements make it bigger, right? A video shows viewers how to perform a basic dilation with a fractional scale factor. They learn how to use the scale factor to find the location of the transformed vertex by multiplying the horizontal...
Other popular searches
- Graphing Coordinate Planes
- Plotting Coordinate Planes
- Christmas Coordinate Planes
- Coordinate Planes Math
- Coordinate Planes Worksheets
- Coordinate Planes Blank
- Graph Coordinate Planes
- Ed Helper Coordinate Planes
- Coordinate Planes Line Graph
- Coordinate Planes Math Free


