Curated OER
Geometry Standardized Test Practice
In this angles and figures review worksheet, 10th graders solve and complete 39 different multiple choice problems. First, they find the length of a line between two given points. Then, students name the type of transformation and the...
Curated OER
Using the Balance
Young scholars determine the mass of various objects. In this integrated math and science instructional activity, students use an arm balance to compare a known object to a combination of washers with a fixed weight. Young scholars...
Curated OER
Fishing for Points
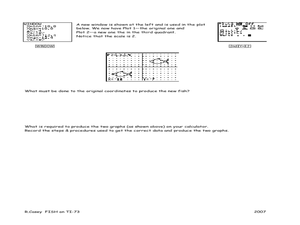
Learners explore the concept of ordered pairs. For this ordered pairs lesson, pupils list the ordered pairs of a graph in the shape of a fish. They use their calculator to translate the fish using lists, then translate the fish left,...
Curated OER
Related Angles
In this angle worksheet, students identify angles and then determine the related angle. Examples are provided. This one-page worksheet contains 36 problems, with answers at the bottom of the page.
Curated OER
What a Site!
Fourth graders are introduced to how to properly create a grid site. In groups, they use Cartesian coordinates to establish the boundaries for the grid and photograph the location of artifacts. They exchange their photos with another...
Curated OER
Graphing Polar Coordinates
Young scholars engage in a lesson that is about the plotting of polar coordinates while graphing equations. They plot multiple points with the help of a graphing calculator and using coordinate graph paper. Students identify the pattern...
EngageNY
Writing the Equation for a Circle
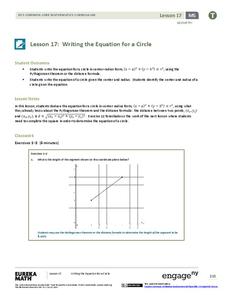
Circles aren't functions, so how is it possible to write the equation for a circle? Pupils first develop the equation of a circle through application of the Pythagorean Theorem. The lesson then provides an exercise set for learners to...
EngageNY
First Consequences of FTS
Challenge the young mathematicians to find the exact coordinates of a dilated point. The fifth segment in a 16-part series introduces the class to the converse of the Fundamental Theorem of Similarity. Scholars use the theorem to find...
EngageNY
Four Interesting Transformations of Functions (Part 1)
Understanding how functions transform is a key concept in mathematics. This introductory lesson plan makes a strong connection between the function, table, and graph when exploring transformations. While the resource uses absolute value...
West Contra Costa Unified School District
Graphing Piecewise Functions
Step up to learn about step functions. The lesson, designed for high schoolers, first covers piecewise functions and how to draw their graphs. It then introduces step functions, including the greatest integer (floor) and ceiling functions.
Curated OER
Slope of a Line
In this slope of a line worksheet, students solve and graph 2 different problems that include determining the slope of a line using the equation y=mx+b. First, they define the slope of a line and the y-intercept. Then, students use the...
Rice University
College Algebra
Is there more to college algebra than this? Even though the eBook is designed for a college algebra course, there are several topics that align to Algebra II or Pre-calculus courses. Topics begin with linear equation and inequalities,...
Radford University
Distance and Midpoint Formulas in a Mall
Go for a walk in the mall. Pupils find distances between stores on a diagram of a mall on Quadrant I. The scholars also determine the midpoint between a store and an entrance to the mall to then create their own paths and determine their...
Mathematics Assessment Project
Sugar Prices
Sugar rush! In this assessment task, learners interpret points on a scatter plot representing price versus weight for bags of sugar. They then determine the bag that represents the best value.
Mathed Up!
Rotation
Two videos show first how to perform a rotation, given the center, the angle, and the direction of rotations. Individuals then see how to find what the rotation is from one figure to another. Pupils practice doing both in seven problems...
CK-12 Foundation
Vector Addition
View vector addition with a greater magnitude. The interactive provides learners with the opportunity to determine the magnitude of vectors and their resultant vectors when added. Pupils investigate the relationship between the...
GeoGebra
Leaping Lizards
Transform lizards onto different locations. The interactive provides a diagram of a lizard and several locations. Pupils use their knowledge of transformations to move the lizard to the different locations and use the tools of GeoGebra...
CK-12 Foundation
Vector Sum and Difference: The Country of Dreams
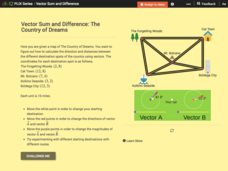
Find your way around using vectors. Scholars use an interactive to learn about vector addition. They answer a set of questions about modeling a route on a map using vectors.
Shodor Education Foundation
Scatter Plot
What is the relationship between two variables? Groups work together to gather data on arm spans and height. Using the interactive, learners plot the bivariate data, labeling the axes and the graph. The resource allows scholars to create...
Corbett Maths
Enlargements with Fractional Scale Factors
Enlargements make it bigger, right? A video shows viewers how to perform a basic dilation with a fractional scale factor. They learn how to use the scale factor to find the location of the transformed vertex by multiplying the horizontal...
Corbett Maths
Transformations of Graphs
Geometric transformations in algebra ... what? Given four transformations, the narrator explains how each affect the graph of the original function. The transformations involve translations and reflections, both horizontally and...
Curated OER
Exponential Growth and Decay
Quiz your middle and high schoolers on solving exponential growth and decay. First, they evaluate for a variable given the second variables value. Then, they graph an equation that illustrates the exponential growth or exponential decay...
Curated OER
Line of Best Fit
In this line of best fit worksheet, students solve and complete 8 different problems that include plotting and creating their own lines of best fit on a graph. First, they study the samples at the top and plot the ordered pairs given on...
CPM
Tables, Equations, and Graphs
Eighth and ninth graders solve and graph 24 different problems that include completing input/output tables and graphing the pairs. First, they find the missing values for each table and write the rule for x. Then, students write the...
Other popular searches
- Math Coordinate Plane
- Math Coordinate Plane Blank
- Coordinate Planes Math Free
- Math Slope Coordinate Plane
- Ell Math Coordinate Plane


