PBL Pathways
Medical Insurance 3
Create a technical report explaining the components of a medical plan through a function. The project-based learning activity gives a medical insurance scenario that young mathematicians model using piecewise functions. Their analyses...
Curated OER
Tiling a Patio
Fifth graders practice, with spreadsheets, to demonstrate how to determine the number of tiles needed to create a patio. They use pictures and gathered data to determine a pattern that can be used to solve problems. Students create a...
Curated OER
Histograms and Statistical Graphics
In this statistics worksheet, students solve 6 data problems. They construct a histogram of given data, they create a frequency polygon, and a stem and leaf diagram. Students create a dot plot and a pie chart for given data sets. On the...
Curated OER
How does Your Province Stack Up?
Students investigate data about age, and sex of a population. In this statistics lesson, students are given data on a population to analyze and compare to other provinces. This assignment is part of a geography lesson and requires 3...
Curated OER
The Land of Immigrants
Students access information and data about US immigration using the Internet and other sources. They identify from research data the countries from which the largest number of immigrants to the US come from and create a database of these...
Curated OER
Strings and Springs
Ninth graders explore physics with springs and strings. In this force and motion lesson, 9th graders rotate through four stations exploring how various springs stretch and bounce, and how mass and length affect a pendulum's swing. They...
Curated OER
Variables and Patterns: Determining an appropriate scale while graphing
Sixth graders determine appropriate scales when graphing data. In this graphing lesson, 6th graders use an the applet "Graph It" to determine what is an appropriate scale for their data.
Curated OER
Investigating Median, Mode, and Mean
Students develop strategies to organize data while following teacher demonstration. They calculate the mean, median and mode of a data set while determining the relationships between the numbers. They analyze data from tables and double...
Curated OER
Whole Lotta Shaking Going On
Students explore earthquake activity in California. They observe the historical data and create databases and graphs of the earthquakes. Students analyze the data and form a hypothesis about future earthquakes.
Curated OER
Math: Will The Airplane Get Off the Ground?
Students use data from real-life models to calculate and compare the force required for an airplane of a given weight to become airborne. They use a graphing calculator to evaluate data and use the World Wide Web to access data.
Curated OER
Box Plots
Students review the concept of median, explore how to calculate quartiles for any size data set and experience how to build a box plot.
Curated OER
Box-and-Whisker
Seventh graders are introduced to the concept of box-and-whisker plots. A step-by-step process for creating a box-and-whisker plot is provided. The goal of the lesson is that students study the components of a box-and-whisker plot and be...
Curated OER
Harry Potter Research Project
Young scholars work together to complete a research project on Harry Potter. They write a research question and develop a survey to give to their classmates. Using the results, they create a graph and draw conclusions about the data...
Curated OER
Rocketsmania And Slope
Students use a professional basketball team's data and graph it on a coordinate plane. They draw a line of regression and finding its equation. They access a website containing statistics for the Houston Rockets basketball team to solve...
Curated OER
Are you an Energy Saver STAR?
Young scholars examine how to use energy more efficiently in their own home. They collect data from their home, complete a chart, read a power meter, interpret the data from an electric and gas bill, and create a poster demonstrating how...
Curated OER
Statistics Newscast in Math Class
Students study sports teams, gather data about the teams, and create a newscast about their data. In this sports analysis instructional activity, students research two teams and define their statistical data. Students compare the two...
Curated OER
Different Perspectives of Oregon's Forest Economic Geography
Students map data on employment in wood products manufacturing in Oregon counties. In this Oregon forest lesson, students discover the percentage of people employed in the forest manufacturing industry. Students create a box and whisker...
Curated OER
Interpreting Graphs
Sixth graders interpret linear and nonlinear graphs. They create graphs based on a problem set. Next, they represent quantitive relationships on a graph and write a story related to graphing.
Physics Classroom
Action at a Distance Lab
The concepts involved with static electricity are typically taught in upper elementary physical science units. The lab described in this resource has pupils examine the behavior of small pieces of paper and a balloon when a charged piece...
Curated OER
Mathematics Within: Bar And Pie Graphs
Students compare and contrast the use of bar and pie graphs with the same data. They create a data set by surveying all students in the class using sticky notes to make a table on the board. Then, each student creates a bar and pie graph...
Curated OER
Childhood Obesity
Students identify a question to generate appropriate data and predict results. They distinguish between a total population and a sample and use a variety of methods to collect and record data. Students create classifications and ranges...
Curated OER
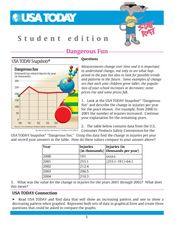
Dangerous Fun
In this line graph worksheet, students analyze the data on a graph about toy-related injuries by year. Students solve 5 problems in which the change in injuries per year is calculated and recorded on a table.
It's About Time
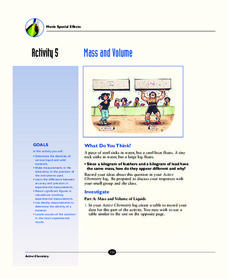
Mass and Volume
Don't be so dense that light bends around you; study the relationship between mass and volume instead. Young chemists measure the density of a variety of liquids and solids. A reading passage and analysis questions introduce pupils to...
Virginia Department of Education
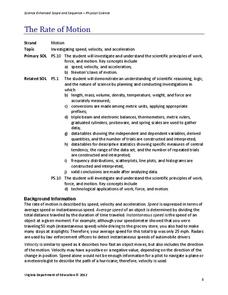
The Rate of Motion
How much time does it take to jump over three balloons? Pupils calculate the speed of tasks that require different motions. They determine motions for tasks such as walking, skipping, hopping, and jumping before creating a spreadsheet...


