NOAA
Tracking a Drifter
Be shore to use this drifter resource. The third installment of a five-part series has learners using the NOAA's Adopt-a-Drifter website to track to movement of a drifter (buoy) in the ocean. Graphing the collected data on a map allows...
Curated OER
Survey Says...
Young learners create and implement a school-wide survey about student body favorites! Learners record and analyze the data on a bar graph, picture graph, and line graph, and then display the data. Then, wrap it all up with a celebration...
Living Rainforest
Finding the Rainforests
From Brazil to Indonesia, young scientists investigate the geography and climate of the world's tropical rain forests with this collection of worksheets.
Curated OER
Graphing
Fifth graders practice using math graphs. In this graphing lesson plan, 5th graders work in groups to develop a topic of their own to represent as a graph. Students collect data and construct a graph for the lesson plan.
Curated OER
"Comprehension of Word Problems" Using a Table
Sixth graders practice solving math problems by utilizing a data table. In this number sense lesson, 6th graders create a table using the numerical information about a fictitious farm's inventory. Students complete the empty segments by...
Curated OER
Meatiest States: Graph Problem Solving
In this graph problem solving instructional activity, students analyze a graph that shows commercial red meat production in five states. Students answer 5 word problems using the data on the graph.
Curated OER
All Choked Up By Smoking Statistics
Scholars use the article "More College Learners Are Smoking, Study Says" as a springboard for discussion on the reasons why people smoke cigarettes. They investigate different methods of graphing statistics by using the data provided in...
NTTI
Line 'Em Up!
Coordinate planes and Cartesian graphing systems are the focus of this math lesson. Learners use video, internet activities, and engage in hands-on activities in order to explore coordinate planes. The materials needed for this lesson...
Curated OER
Tables, Charts and Graphs
Young scholars examine a science journal to develop an understanding of graphs in science. In this data analysis lesson, students read an article from the Natural Inquirer and discuss the meaning of the included graph. Young...
Curated OER
Graphing
Pupils gather statistical information on a chosen topic and place it into a spreadsheet. Using th Excel chart wizard, students create tables, graphs and charts of their information. They interpret the data and share it with the class.
Curated OER
Misleading Graphs
Students explore number relationships by participating in a data collection activity. In this statistics lesson, students participate in a role-play activitiy in which they own a scrap material storefront that must replenish its...
Curated OER
Using Computers to Produce Spreadsheets and Bar Graphs
Students review graphing terminology and how to plot data points, how to input data into a spreadsheet, and how to make a chart using a computer.
Curated OER
Getting A Grip On Graphs
Fourth graders investigate the concept of graphing and comparing different types of data using pictographs, line graphs, scatter plots, etc... They gather data and make interpretations while examining the medium of how it is displayed.
Curated OER
RCX Car Line Graph
Learners develop a line graph based on distances that an RCX car drives in specified amounts of time. They then are given a specific amount of time for the car to drive and be asked to extrapolate the car's distance from the graph.
Curated OER
All in the Family
Students use data to make a tally chart and a line plot. They find the maximum, minimum, range, median, and mode of the data. Following the video portion of the lesson plan, students will visit a Web site to test their data collection...
Curated OER
Using Current Data for Graphing Skills
Middle schoolers graph demographic information. In this graphing lesson, students choose what type of graph to create and what information to display. Links to examples of graphs and statistical data are provided. The graphs are created...
Towson University
Looking Backwards, Looking Forward
How do scientists know what Earth's climate was like millions of years ago? Young environmental scholars discover how researchers used proxy data to determine the conditions present before written record. Grouped pupils gain experience...
Los Angeles County Office of Education
Assessment for the California Mathematics Standards Grade 5
Test young mathematicians' knowledge with an assessment aligned to California's fifth grade state standards. The exam covers a multitude of concepts including fractions and decimals, positive and negative numbers, measurement; and...
Illustrative Mathematics
Invertible or Not?
Two for one—create an invertible and non-invertible function from the same data. The task presents a function table with missing outputs for the class to use to create two functions. One of the functions should have an inverse while the...
Shodor Education Foundation
Regression
How good is the fit? Using an interactive, classmates create a scatter plot of bivariate data and fit their own lines of best fit. The applet allows pupils to display the regression line along with the correlation coefficient. As a final...
Curated OER
Speed + Graphing = Winners!
Fifth graders take addition timed tests every day for a two week period. Using the data from the timed tests, they create a bar graph using Microsoft Excel computer software, a personal bar graph using graph paper and colored pencils,...
Curated OER
Testing the Waters
Eleventh graders examine a local body of water. For this science lesson, 11th graders collect water samples to test. Students analyze the data and make conclusions. Students create tables and graphs of the data.
Curated OER
Using Graphs and Charts
Students complete T charts and manipulate numbers using graphs and charts. For this math graphs and charts lesson, students review the concepts of pattern and function. Students then complete practice pages where they manipulate numbers...
Curated OER
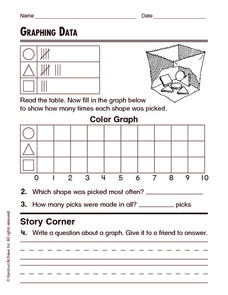
Graphing Data
For this graphing data worksheet, learners solve and complete 8 different word problems related to graphing data given. First, they determine the percent of people who do not believe in any of the phenomena described and explain. Then,...


