Curated OER
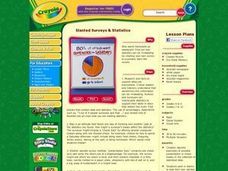
Slanted Surveys And Statistics
Students engage in a lesson plan that is concerned with the use of statistics and surveys and how they should be read. They create a survey and take it home to collect data. Then students display the data on a graph that is displayed in...
Social Media Toolbox
Social Media Survey
Survey says ... social media is here to stay! How do the pupils in your school use social media? Using lesson four from a 16-part series, The Social Media Toolbox, learners study surveys and create their own. The resource includes...
Curated OER
And the Survey Says...
Create a survey and graph! In this graphing lesson, learners listen to a story about pets, create a survey for family and friends about what pets they own, and use the information to create a bar and line graph.
Radford University
PHamily PHeud: An Exploration in Surveys
Get to know the class much better. Scholars brainstorm a topic of interest and then design and conduct a class survey. Using the top responses, they create a game similar to Family Feud and take part in a class competition.
Spreading Gratitude Rocks
Values Survey
What are the most important values a person possesses? Teens and parents take a collaborative survey and discuss what values are important to them. They return the signed form to the teacher to confirm they completed the activity.
Curated OER
Survey of Height
For this data collection worksheet, learners survey the heights of their fellow classmates, organize their data in a data table, and create a bar graph from their data. Once bar graph is completed, students complete 2 short answer...
Curated OER
Create a Public Opinion Survey: The Middle East in the News
Though the discrete content here is a pair of New York Times articles about a 1998 military strike on Iraq and the coincident impeachment by the House of Representatives of then-President Clinton, this detailed plan for creating,...
Curated OER
Survey Says...
Young statisticians collect, organize, and present data to illustrate responses to a survey question. They write and conduct the survey. They finish by presenting the results in the form of a graph.
Curated OER
Predictions Survey
Help English learners make predictions using appropriate language through a survey. Each learner will ask a series of questions to 5 different students and then create a short report on their findings. Modifications: Add your own series...
Curated OER
Technology use survey
Survey your class to find out how often and what technology they use. They will answer 5 questions to 5 students and then create a short report on what they learned about their classmates' technology use.
Curated OER
Surveys and Graphing
First graders survey different classrooms to determine types of products students would like to see sold at school, and create graphs based on survey results.
Teaching Heart
Proud To Be Me!
Another school year brings another group of unique and interesting learners into your classroom. Learn what makes these new kids tick with this questionnaire that asks for basic background and personal interest information.
Curated OER
Strict Parents
Are your parents or guardians strict? That's an interesting question many of your pupils are probably interested in discussing. How do you design a study directed at your high schooler to gain insight into that question? How do you...
Curated OER
Cell Phones Create Dangers
Students research what laws relate to cell phones. They interview local law enforcement personnel to find out if cell phones have caused accidents. Students survey classmates to determine how many talk on their phones when driving. They...
EngageNY
Creating a Dot Plot
Which dot am I? Pupils create dot plots to represent sample data through the use of frequency tables. The third segment in a series of 22 asks individuals to analyze the dot plots they created. The scholars translate back and forth...
Curated OER
Recycling Survey
How many people really recycle recyclables and how do they feel about it? High schoolers create a survey to find out. Once they agree on what questions to include, they each interview four people outside of the classroom. They combine...
Energy for Keeps
Renewable Energy Action Project: What's in Your Energy Portfolio?
Uncover the renewable energy potential in your region. The activity outlines an approach to research current practices and trends. Learners conduct surveys to assess the attitudes of the local population and prepare a paper summarizing...
US Department of Agriculture
Agriculture Counts
Agricultural survey and the documentation of livestock or goods was the basis for the first written language. Youngsters discuss sorting and counting, and how these skills have been used for thousands of years. They accent their class...
Worksheet Place
How I Get to School
Find out how many of your learners take the bus, how many walk, and how many bike with a quick survey. Class members gather data about how each individual gets to school and mark the results on this page in order to create a bar graph.
Curated OER
Create a Graph Online
Scholars create colorful bar, line, or pie graphs. They decide on a survey question to ask or a type of data to gather. From there, they collect information and data. They display this data in bar, line, or pie graphs that they create...
Curated OER
Survey Says...
Young learners create and implement a school-wide survey about student body favorites! Learners record and analyze the data on a bar graph, picture graph, and line graph, and then display the data. Then, wrap it all up with a celebration...
Curated OER
Students' Favorite Reading Topics
Students complete surveys about their favorite reading topics to determine the kinds of books to purchase for the school library.
Radford University
Data Analysis Activity
What do classmates think? In groups, learners design surveys to investigate chosen topics. They conduct the survey, then analyze the results. As part of the activity, they must calculate the mean, median, mode, variance, and standard...
Curated OER
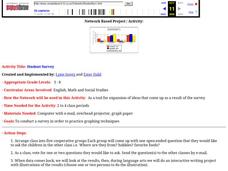
Student Survey
Students create questions they would like to ask another class of Students, send the questions by email, examine results, and create slideshow illustrating results.


