Curated OER
The Only Thing We Have To Fear...
Students explore the appeal of fear in today's society and beliefs about the paranormal, specifically ghosts. They create a survey to be distributed throughout the school regarding beliefs in ghosts and other supernatural beings and forces.
Curated OER
Energy Busters: Home Energy Conservation
Students survey home energy use and develop an energy conservation plan.
Curated OER
CAREER CHOICES
Young scholars survey common professions and occupations in the community. They create scrapbooks which depict ten different jobs. They create pictures of the 10 occupations and label the occupations. They write a brief (1-2 sentence)...
Curated OER
Plotting Data on a Graph
Young scholars investigate graphing. For this graphing lesson, students survey the class and create graphs to reflect the data collected.
Curated OER
Travel Fun
In this bar graph worksheet, students survey classmates about their favorite way to travel. Students then fill in one square for each response creating a horizontal bar graph.
Curated OER
Posting Our Rules
Students illustrate classroom rules. In this common good lesson, students survey a variety of posters and discuss the messages they send. Students create their own poster illustrating classroom rules to be followed and hold a...
Curated OER
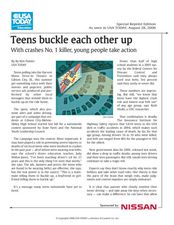
Teens Buckle Each Other Up
Students explore teen driving habits. In this health journalism lesson, students read the USA Today article titled "Teens Buckle Each Other Up", respond to discussion questions regarding the article, and complete an activity based on the...
Curated OER
The Influence of Advertising
Students analyze advertisements and develop guidelines for viewing advertising. In this advertising lesson, students discuss print ads, TV commercials, and other examples of ads. Students survey their friends or relatives about their...
Curated OER
Surveys
Students collect data from middle school survery. They tabulate percentages by grade level. They create a graph to display the survey results.
Environmental Protection Agency (EPA)
How Much Water Do You Use?
Incorporate reading strategies, math, research, and the scientific method into one lesson about water conservation. After reading a story about a landlady trying to determine how many people are living in an apartment, learners develop a...
National Security Agency
Are You Ready to Call the Guinness Book of Records?
Learners design questions that can be answered by collecting data. In this line-plot lesson, pupils collect data and graph on a line plot on world records. An abundant supply of teacher support is provided in this resource.
Curated OER
How Tolerant Are Kids in Your School?
Students graph results of a survey about attitudes and tolerance in their school. They discuss the social climate of their school. Students complete a questionnaire, and tabulate the raw data from their class. They create a bar graph...
Odyssey of the Mind
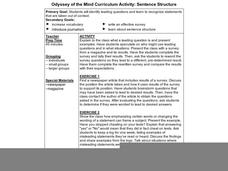
Odyssey of the Mind Curriculum Activity: Sentence Structure
Statements can be taken out of context and interpreted or used to support a very different view than the one originally intended. Young journalists start thinking about leading questions, sentence structure, context, and how they all...
Curated OER
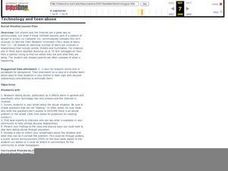
Technology and Teen Abuse
Students research dating abuse, particularly as it affects teens in general and specifically when technology like cells phones and the Internet is involved. They develop and use a survey on dating abuse in thier school and use the...
Curated OER
Graph It!
There is more than one way to represent data! Learners explore ways to represent data. They examine stacked graphs, histograms, and line plots. They conduct surveys and use stacked graphs, histograms, or line plots to chart the data they...
NOAA
What's the Difference?
Due to the isolation of seamounts, their biodiversity offers a great deal of information on the development of biological and physical processes. Pupils use simple cluster analysis to rate the similarity and differences in biological...
Curated OER
Using Graphical Displays to Depict Health Trends in America's Youth
Identify the different types of graphs and when they are used. Learners will research a specific health issue facing teens today. They then develop a survey, collect and analyze data and present their findings in class. This is a lesson...
Chicago Botanic Garden
Reflecting on What I Learned About Climate Change
After three eye-opening lessons about our environment, scholars revisit a 10-question survey, reflect on their new-found knowledge, and take action by writing to a representative or creating a public service announcement about climate...
Cornell University
What is IPM?
Discover what a pest is and how to identify one with a lesson that looks closely at our outside world and taxonomy. Scholars investigate insects and plants to practice their identification skills, take a survey, and explore the...
Curated OER
What Are Bullying And Harassment?
Fourth graders define the four types of bullying and define harassment. They complete a True/False survey, student notes, and question and answer.
PLS 3rd Learning
Vehicle Comparison Shopping
This is part of a larger unit on cars (financing, insurance, budget, etc.). Before comparison shopping for their ideal car, teens fill out a survey on their transportation preferences. In related lessons, they consider financing,...
National Security Agency
Going Green with Graphs
For this unit designed for second graders, youngsters are introduced to conducting surveys and creating tally charts based on the data they gather. Students then construct bar graphs, and observe the relationships between the two types...
Mikva Challenge
Why Vote?
Elections are supposed to represent the will of the people. So why don't 100% of registered voters line up at the polls on Election Day? High schoolers study the last few elections and the voter turnout for each, according to race,...
EngageNY
Estimating Probability Distributions Empirically 1
What if you don't have theoretical probabilities with which to create probability distributions? The 11th installment of a 21-part module has scholars collecting data through a survey. The results of the survey provide empirical data to...


