Curated OER
On the Road
Students create a diorama to illustrate the challenges of and requirements for long distance travel in the West before the coming of the railroads.
Curated OER
Definition Lists
Learners create a list of items with indented text block definitions in an HTML document. They produce a bibliography with a definition list.
Curated OER
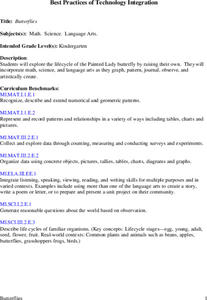
Butterflies
Students will explore the life cycle of the Painted Lady butterfly by raising their own. They will incorporate math, science, and language arts as they graph, pattern, journal, observe, and artistically create.
Curated OER
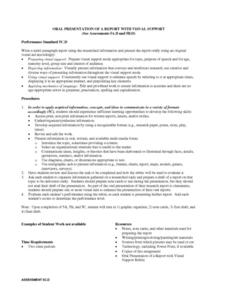
Oral Presentation of a Report With Visual Support
High schoolers create multi-paragraph report using the researched information. Over several class periods, students research a topic of their choosing and create a one-two page report. Student reports are presented to the class using...
Curated OER
Jelly Belly: What a Wonderful "Bean"!
Students explore how jelly beans are produced. They discuss the origins of the jelly bean and view a video about how jelly beans are prepared, tested, shaped, finished, and shipped and estimate the amount of jelly beans in a jar and sort...
Curated OER
Where Have All the Endangered Gone?
Students explore animals that are endangered. They choose an endangered animal that they would like to keep from becoming extinct. Students create a persuasive presentation to persuade someone to understand why they feel keeping their...
Curated OER
Finding Content/Media
Sixth graders use the web to find and download photos, images, and clip art to create a large library of images in a short time. They survey audio and video files and other media by using various search engines. Remember to follow...
Curated OER
Graphing Regions: Lesson 2
Students identify and analyze geographical locations of inventors. They each identify where their inventor is from on a U.S. map, discuss geographic patterns, and create a t-chart and graph using the Graph Club 2.0 Software.
Curated OER
Entrepreneurs are Born, but Can They Be Taught?
High schoolers explore the concept of entrepreneurs. In this entrepreneurs lesson, students read an article about entrepreneurship and whether or not it is an inherent trait or a learned skill. High schoolers discuss why entrepreneurship...
Curated OER
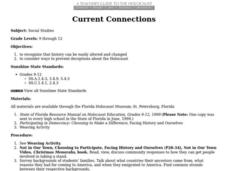
Current Connections
Students recognize that history can be easily altered and changed, and consider ways to prevent deceptions about the Holocaust. They create class quilt that shows how to create harmony, understanding and tolerance of others.
Curated OER
Persuading the Assembly
Students critique a power point presentation. They create power point presentation.
Curated OER
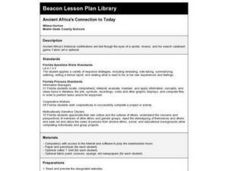
Ancient Africa's Connection to Today
Fourth graders engage in a lesson in which ancient Africa's historical contributions are told though the eyes of a spider, Anansi, and his search calabash game. The game is accessed through a website which is embedded in this lesson plan.
Curated OER
Make a Community Almanac
Pupils gather geographic information about their community. They work together to create a community almanac.
Curated OER
Public Policy Changes Using Technology
Young scholars discuss the problem of wrestling on the playground that has resulted in injuries to classmates. They research the problem using print and Internet resources. They listen to a presentation by the high school wrestling...
Curated OER
American Revolution (And What if There Had Not Been One?)
Eighth graders create scenes that might have existed if the American Revolution had not taken place. They use information they have gathered to plan, produce, and present a variety of products from the perspective of a British citizen in...
Curated OER
Knock On Wood
Students investigate the trees of the Mississippi Valley, specifically looking at the coniferous and deciduous forests. The research of the area is part of a field study when students conduct a survey of local forests in order to create...
Curated OER
Samuel's Choice - Social Studies Using Children's Literature
Fifth graders read a book about independence, freedom, and slavery. Students create a story map of the book. They research the causes of the Civil War. Students write a newspaper article from the point of view of an American colonist.
Curated OER
Unknown Vocabulary
Students develop the vocabulary necessary to make their reading meaningful. After creating pre-reading activities, students a list of unknown vocabulary related to their reading selection. They complete vocabulary and context...
Curated OER
Making Babies
Students participate in a genetics activity in which they determine genotypes and phenotypes for given traits. They work with a partner and create babies based on their genotypes. Once traits for babies are determined, they write...
Curated OER
Statistics: Misleading or Accurate?
Students explore the concept of misleading statistics. In this misleading statistics lesson, students play a game of tag and graph the number of times each student gets tagged. Students use the graph to determine the fastest runner in...
Curated OER
Your Politician: Myth vs. Reality
Students adopt a public official, research how they spend their time, and define the actual duties associated with the job. They sort perceptions about the job into myths and realities, and analyze political cartoons involving their...
Curated OER
Favorite Season Circle Graph
Students create a graph charting their favorite season. They discuss the difference in the four seasons and activities they participate in, in each of the seasons. They can also take a survey of their family members and add them to the...
Curated OER
The Family That Endured An Historical View of African-American Families As Seen Through American Literature and Art
Students identify racial stereotypes in advertisements from the past and survey their sources and implications. They compare advertisements from the past with those of today using similar approaches and create an original advertisement...
Curated OER
Histograms and Statistical Graphics
In this statistics worksheet, students solve 6 data problems. They construct a histogram of given data, they create a frequency polygon, and a stem and leaf diagram. Students create a dot plot and a pie chart for given data sets. On the...


