Curated OER
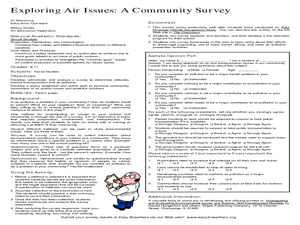
Exploring Air Issues
Young scholars collects survey data from their community on air pollution. In this environmental science lesson, students consider the opinion of the community on air pollution and create a plan to reduce it. Young scholars plan on...
Curated OER
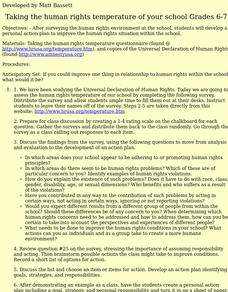
Taking the human rights temperature of your school
Students, after surveying the human rights environment at the school, develop a personal action plan to improve the human rights situation within the school.
Curated OER
Closing the Case
Fifth graders collect data and prepare data displays using a survey with statistical information.
Curated OER
Design a Community Flag
Students research basic principles for flag design. They investigate where their city flag ranked in a national survey. Students use computers and apply the principles of flag design to create their own community flags.
Curated OER
Lands That I Love
Students create a graph showing their family roots. They read about how immigrants can develop strong feelings for two countries. They discover the importance of their earliest memories.
Curated OER
Thinking about Energy
Students navigate through a web-based survey to help engage curiosity about energy concepts. They describe how prior perceptions influence examineing of energy concepts. They evaluate comprehension about concepts of energy.
Curated OER
Statistical Accuracy and Reliability
Ninth graders assess the accuracy and reliability of current survey data and how it is represented. They design a survey, collect data, and use technology to analyze the data and present the results. Students examine scatter plots and...
Curated OER
What Can Scatterplots Tell Us?
Eighth graders use data from surveys conducted with parents, peers and themselves to create computer-generated scatterplots. They make inferences from their scatterplots.
Curated OER
Running a School Bakery
Students explore marketing concepts while producing food items to sell.
Curated OER
Ketchup to Collecting Data
First graders collect data for a survey of 3 brands of ketchup and create class charts. They taste test three different brands of ketchup, and use the data to create a presentation. Tasty lesson!
Curated OER
Report of Shop, Factory, Mill or Industrial Establishment
Students examine the pollution survey created in response to the Public Health Laws of 1903, and compare/contrast polluting factory discharges in 1903 to those allowed today. They analyze the report survey, complete a worksheet, and...
Curated OER
Graphing Data
Second graders examine how to make and read bar graphs. In this bar graph lesson, 2nd graders compare bar graphs to pictographs by looking at hair color survey data. They practice making a bar graph and finding the range of the data.
Curated OER
Frenzied Food: Fantastic Fuel?
Students infer the causes of obesity. In this health science lesson, students brainstorm ways improve to their diet. They write personalized journals with goals on how to live a healthy lifestyle.
Curated OER
What Will We Become?
Students create an action plan based upon the results of the School Climate Survey. They implement the plan as demonstrated by a daily log of activity. They complete group and individual reflection and evaluation activities.
Curated OER
Follow a Bill!
Learners participate in an activity to discover how a bill becomes law in California. In groups, they create a school program based on their own ideas for change. They develop and conduct a survey within their community and present their...
Curated OER
Questions for Today: Communities
Students discover how questionnaires help communities to determine the needs of its citizens. They make an analogy between a survey of students about their school and a survey of citizens about their community.
Curated OER
Issues Awareness
Students work together to create a survery about environmental issues in their community. They calculate and graph the results. They discuss the importance of surveys to engineers.
Curated OER
Your Local Area
High schoolers investigate the meaning of regional differences as they study a survey written about the different ways people like to eat chips and design and make a poster to show what makes their area unique.
Curated OER
Floodplains in the field (with GIS)
Students measure a topographic and geologic cross-section across a floodplain by simple surveying and auguring techniques. They consider the spatial context of the field observations, use GPS measurements, and desktop GIS analyses.
Curated OER
A Pocketful of Change
Students study the meaning, symbolism, and value of U.S. coins,
especially the quarter. They conduct a survey of coins in students'
possession, graphing the results to show frequency distribution and drawing
inferences about the U.S....
Curated OER
Do You Have a Coin Collection?
Learners create a graph showing which students in the class collect coins.
Curated OER
Do You Like to Spend or Save?
Students, after briefly discussing spending and saving habits, take a poll to see how their peers like to manage money. Then students graph their findings and discuss the survey results.
Curated OER
What's Your Favorite Stuffed Animal?
Second graders gather information in a survey and interpret the results using a tally chart, a table, and a bar graph. They' present their results of the during the final group discussion. The subject of the survey is favorite stuffed...


