Federal Trade Commission
Ad Creation
How would someone market a new cereal to space aliens? Using the third lesson from a four-part Admongo series on advertising, pupils learn about persuasive techniques companies use to convince consumers to purchase their products. As a...
PBS
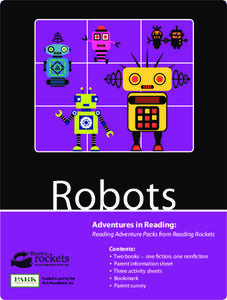
Reading Adventure Pack: Robots
Two activities work with a fiction and nonfiction book about robots‚—Robot Dreams by Sara Varon and Robot by Roger Bridgman. Scholars read each story, then build a robot out of found objects, examine robot sensors, and search for...
PBS
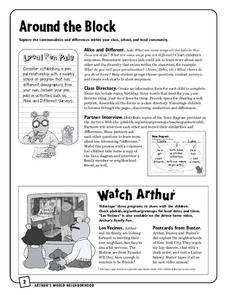
Around the Block
Arthur and his friends help children explore the concepts of family, community, and diversity in a fun series of activities. From performing peer interviews to mapping out the different places students have lived or visited, this...
California Department of Education
I’m Ready to Work
Get ready to apply yourself! Lesson four in a series of five college and career readiness lessons introduces the basic parts of a job application. Pupils discover the necessity for good references and create a master job application for...
Illustrative Mathematics
Favorite Ice Cream Flavor
What better way to engage children in a math lesson than by talking about ice cream? Using a pocket chart or piece of chart paper, the class works together creating a bar graph of the their favorite ice cream flavors. Learners then work...
Visa
The Tools to Build Your Financial Dream
When it comes to all the ways money management and financial responsibility weave into our daily lives as adults, make sure students are prepared to locate resources for managing their finances, such as a financial advisor.
Virginia Department of Education
May I Have Fries with That?
Not all pie graphs are about pies. The class conducts a survey on favorite fast food categories in a lesson on data representation. Pupils use the results to create a circle graph.
Pearson
End-of-Year Portfolio Guidelines
Go beyond a traditional end-of-the-year survey and have your middle school pupils compile a portfolio of work illustrating their progression as a writer.
California Education Partners
Colorful Data
Scale up your lessons with a performance task. Young data analysts work through an assessment task on scaled bar graphs. They answer questions about a given scaled bar graph on favorite colors, analyze a bar graph to see if it matches...
PBS
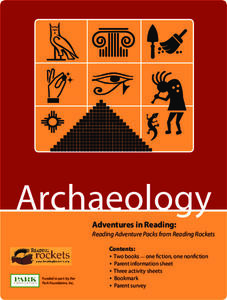
Reading Adventure Pack: Archaeology
Readings of fiction and nonfiction texts followed by a series of activities put scholars in an archaeologist's shoes. Learners read two texts, Archaeologists Dig for Clues by Kate Duke and The Shipwrecked Sailor: An Egyptian Tale with...
Ontario
Reading Graphic Text
Do students really need to be taught how to read cartoons, comic books, and comic strips? Yes. Just as they need to learn how to read other forms of graphic text such as diagrams, photos, timetables, maps, charts, and tables. Young...
Open Oregon Educational Resources
How to Learn Like a Pro!
What's the best way to ace an exam or pass a difficult class? Scholars find out using an information-packed eBook. Pupils read about learning styles, study skills, test-taking strategies, and other topics associated with maximizing...
University of Wisconsin
Follow the Drop
Young surveyors look for patterns in water flow around campus. Using a map of the school (that you will need to create), they mark the direction of the path of water. They also perform calculations for the volume that becomes runoff. The...
Michigan State University
4-H Teen Leadership
Take your 4-H teens to the next level! Help them learn how to be an active part of their communities with a teen leadership development unit. Individuals, together with school and community partners, create and execute a service-driven...
Curated OER
The Fisherman and His Wife
Young scholars will conduct a survey, using the information collected they will construct a poster.
Curated OER
Jelly Bracelets: Fashion or Sex Game?
Ever-changing fashion fads are the ideal context for an engaging sociology experiment for adolescents. Through research and conducting a survey, learners draw conclusions about the controversial jelly bracelets fad, banned in some...
Curated OER
Fun Along the Way: Technology and the Teaching of World Languages
Students record themselves saying basic biographical facts about themselves: : what their names are, where they live, how old they are, what languages they speak, and what activities they like to do. They practice their presentational...
Curated OER
Where is Everybody?
Middle schoolers collect data from different grade levels at their school and develop thematic maps which show population density, and determine how this might affect the school and themselves in the future.
Curated OER
Card Combinations
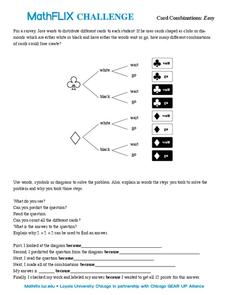
For this card combinations worksheet, students solve and complete 8 different problems that include determining the number of card combinations found. First, they use words, symbols or diagrams to solve the problem and explain the steps...
Curated OER
Rockin' Data
Fifth graders are given the questions, "What type of music would you suggest the manager place in front of the store?". Students collect data by talking with 20 adults and create a bar graph on the computer to present the data.
Curated OER
Data Analysis Digital Display
Students create a survey online. In this math lesson, students graph survey data using flisti.com. They share and analyze their classmates' histogram.
Curated OER
Survey Savvy
Middle schoolers explore various aspects of design innovation. In this design lesson, links are provided to three innovations from the Design for the Other 90% Web site in order for students to study and evaluate them. Middle schoolers...
Curated OER
Cruel Schools
Students survey the climate of their school. In this personal health lesson, students discuss bullying and violence in schools. Students then complete a school climate survey, compile the results, and interpret them. Students write data...
Curated OER
Multicultural Mobile
Pupils create a mobile to show the multicultural diversity in their community. They complete a survey of the people in their neighborhood and the areas they come from. Students use their data to create a mobile that showcases the country...


