Early Childhood Learning and Knowlege Center
My Body My Senses
In a comprehensive unit of activities, learners explore the five senses. Youngsters discover the many different body parts and their functions that allow humans to have sense of sight, touch, smell, taste, and hearing. The best way to...
Pingry School
Acid-Base Indicators
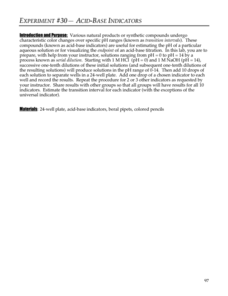
Acid-base indicators are an essential part of any chemistry classroom. Individuals explore the color-changing feature of the important indicators in a vibrant hands-on activity. Using serial dilution, learners create solutions ranging...
Kenan Fellows
Using Water Chemistry as an Indicator of Stream Health
Will this water source support life? Small groups test the chemistry of the water drawn from two different sources. They then compare the collected data to acceptable levels to draw conclusions about the health of the source. The...
Adrian College
The Universe
Young scientists create a simulation of Hubble's law. Introducing the Big Bang Theory using balloons and a simple lab worksheet, scholars complete a data table and perform analysis.
CK-12 Foundation
Using Quadratic Equations to Solve Problems: Pizza Slice!
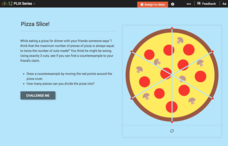
Get the most out of a pizza. Class members use an interactive to simulate cutting a pizza to determine the maximum number of slices possible. The pupils create a set of data points and determine the equation that models the relationship.
It's About Time
Petroleum and Your Community
I was going to write a joke about oil, but it seemed crude. This lesson starts with a comparison of where the US gets oil from and how that has changed over time. After analyzing the data, scholars create a graph and use the Internet to...
CCSS Math Activities
Smarter Balanced Sample Items: 7th Grade Math – Claim 4
Build the model right out of the box. A few sample items show teachers how Smarter Balanced assessments may approach Claim 4, modeling and data analysis. Pupils use their skills to create equations or expressions to model the situation...
Curated OER
Plate Tectonics
Help young scientists piece together the theory of plate tectonics with this comprehensive collection of materials. Whether your are looking for worksheets, hands-on activities, or assessments, this resource has everything...
Curated OER
Reflection and Refraction
Life is only a reflection of what we allow ourselves to see. The lesson includes three experiments on light reflection, light refraction, projection, lenses, and optical systems. Each experiment builds off the ones before and...
EngageNY
Secant Angle Theorem, Exterior Case
It doesn't matter whether secant lines intersect inside or outside the circle, right? Scholars extend concepts from the previous lesson to investigate angles created by secant lines that intersect at a point exterior to the circle....
University of North Carolina
Statistics
Let's see you back it up! As shown in the 18th handout in the Writing the Paper series of 24 lessons from UNC, statistics help form an effective argument. The handout discusses how to analyze a source and break down the data to ensure it...
Curated OER
Line Plots - Homework 6.3
Elementary schoolers use data in a table to make a line plot, then answer five related questions. Houghton Mifflin text is referenced.
Living Rainforest
Finding the Rainforests
From Brazil to Indonesia, young scientists investigate the geography and climate of the world's tropical rain forests with this collection of worksheets.
Curated OER
Finding Equations
Students make equations from everyday data. They create a graph from the equations. Students predict and analyze the results. Students complete the second scenario on their own and turn in their handout.
Curated OER
Testing the Waters
Eleventh graders examine a local body of water. For this science lesson, 11th graders collect water samples to test. Students analyze the data and make conclusions. Students create tables and graphs of the data.
Curated OER
Unit 20 Questionnaires and Analysis Extra Exercises 20.1
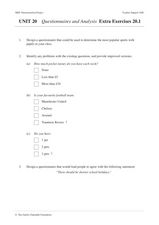
In this statistics worksheet, students design a biased questionnaire. They create data displays based on given statistics. There are a total of 9 problems.
Curated OER
National Marine Sanctuaries Fish
Information is provided on Gray's Reef, Florida Keys, and Flower Garden Banks marine sanctuaries. Young marine biologists then visit the FishBase and REEF databases to collect fish species information for each location. They then...
Towson University
Mystery of the Crooked Cell
Can your class solve the Mystery of the Crooked Cell? Junior geneticists collaborate to learn about sickle cell anemia in a fascinating lesson plan. The included materials help them to examine the genetic factors behind the disease...
Curated OER
Range and Measures of Central Tendency
Third graders take notes on a PowerPoint presentation featuring calculating and analyzing data. They practice skills highlighted in the presentation and create a table in Microsoft Excel showing data analysis.
Curated OER
Conducting a Scientific Investigation
Students investigate a possible health problem in the local school district through inquiry into attendance records, activities, maps, graphs, and data tables. The simulation continues as solutions for the problem are sought.
Curated OER
Give Me Some Sugar, Honey!
Young scholars research the history of honey and different products that come from honey. In this bees and honey instructional activity, students review how honey is made, discuss ways people use honey, research the history of...
Curated OER
M & Ms in a Bag
Students make predictions about the number and colors of M&M's in a snack size package. They create an Excel spreadsheet to record the data from their small group's bag, create a graph of the data, and discuss the variations of data...
Curated OER
Canada's Climate: Temperature and Rainfall Variations
Students analyze data about various climates in Canada. In this data analysis and climate lesson, students use Canada Year Book 1999 to complete a worksheet and make connections between precipitation and temperature in different climates.
Curated OER
Getting A Grip On Graphs
Fourth graders investigate the concept of graphing and comparing different types of data using pictographs, line graphs, scatter plots, etc... They gather data and make interpretations while examining the medium of how it is displayed.


