Georgia Department of Education
The Basketball Star
Have learners use math to prove they are sports stars! Assess a pupil's ability to create and analyze data using a variety of graphs. The class will be motivated by the association of math and basketball data.
Curated OER
Make a Frequency Table and a Histogram for a Given Set of Data
In this data recording and data organization worksheet, students create one frequency table and one histogram for a given list of data. Explanations and examples for frequency tables and histograms are given.
Curated OER
Ordering Rational Numbers and Finding Their Approximate
Middle schoolers explore the concept of ordering rational numbers on a number line. They represent rational numbers as decimals and percents. Pupils create a foldable about converting fractions to decimals to percents, and use a...
K-5 Math Teaching Resources
Show Your Work Recording Paper
"Show your work!" It's the math teacher's mantra. Support your class with meeting this reasonable requirement with this set of recording paper templates.
Radford University
Linear Equations in Real Word Problems
Make up a story about a linear graph. Scholars identify key features of a linear graph, such as intercepts, domain and range, and slope. They then create a word problem that could be represented by the graphed line.
EngageNY
The Graph of a Function
Mathematics set notation can be represented through a computer program loop. Making the connection to a computer program loop helps pupils see the process that set notation describes. The activity allows for different types domain and...
Benjamin Franklin High School
Saxon Math: Algebra 2 (Section 4)
This fourth of twelve units in a series continues the investigation of functions through equations and inequalities. However, the modular nature of the lessons in the section make this an excellent resource for any curriculum covering...
Florida Center for Reading Research
Phonological Awareness - Phoneme Segmenting and Blending, Treasure Chest
Working in pairs, scholars use picture cards to practice segmenting words into phonemes and blending phonemes into words. When a peer answers correctly they place a penny in a treasure chest. Incorrect responses make the card go back in...
EngageNY
Mid-Module Assessment Task: Pre-Calculus Module 4
Challenge scholars to show what they know about properties and addition and subtraction formulas for trigonometric functions. The resource provides a mid-unit check on the progress toward mastery of trigonometric concepts. The areas...
Rice University
Introductory Statistics
Statistically speaking, the content covers several grades. Featuring all of the statistics typically covered in a college-level Statistics course, the expansive content spans from sixth grade on up to high school. Material comes from a...
Curated OER
Graphing from Slope-Intercept Form: Practice A
Ninth graders investigate the slope-intercept form of a line. In this Algebra I lesson, 9th graders graph linear equations by using the slope and y-intercept.
Curated OER
Graphing Data from the Chemistry Laboratory
Students graph and analyze data using a spreadsheet.
Curated OER
Symmetrical Designs with Pretzels and Marshmallows
Fifth graders create designs that have lines of symmetry using pretzel and marshmallows. In this symmetry design lesson plan, 5th graders work in groups using graph paper, rulers, and toothpicks to plan their own lines of symmetry...
Curated OER
Let's Go Slopey
Students create a table of values to graph a line. In this algebra instructional activity, students identify the slope and intercept of a linear equation. They use a Ticalculator to graph their function.
Curated OER
Means of Growth
Students collect and graph data. For this statistics lesson, students analyze their plotted data using a scatter plot. They identify lines as having positive, negative or no correlation.
Curated OER
Cross-Stitching a Frog Bookmark
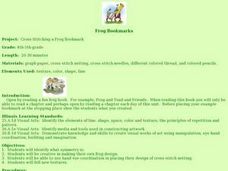
Pupils identify symmetry and create their own frog design. Students apply hand-eye coordination in placing their designs of cross-stitch netting. Pupils identify with new textures. Students present and analyze their design once finished...
Curated OER
Graphing Inequalities
In this graphing inequalities worksheet, students create graphs of algebraic expressions containing inequalities. This two-page worksheet contains explanations and examples prior to the exercise. The first page is a contains...
Curated OER
Straight Graph Lines: Coordinates
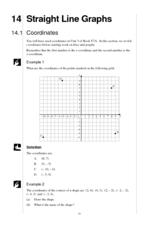
Students access prior knowledge of coordinates. In this coordinates lesson, students graph coordinate points to create a symmetrical figure and of a straight line. Students complete several practice examples.
Curated OER
Cruising the Internet
Students identify the parts of an engine using a graph. In this statistics lesson, students make a graph from their collected data. They calculate the volume of a cylinder using a line of regression and a scatter plot.
Curated OER
Proofs
In this proofs activity, 10th graders solve and graph 8 different equations. First, they prove that each triangle is either congruent or similar. Then, students use the concept of corresponding parts of congruent triangles to solve each...
Curated OER
Chapter Books
In this line plot instructional activity, students create a line plot of the chapter books read by the students of a class and find the median and mode. Students complete 3 tasks.
Curated OER
Using Charts and Graphs to Study East Asia's Modern Economy
Students examine East Asia's modern economy. In groups, classmates use the internet to compare the resources, products, and economy of specified countries. After collecting the data, pupils create charts, tables and graphs. They...
Curated OER
Checking Test Comparability/Scattergrams
Students construct a scattergram graph. In this statistics lesson, students graph data by hand and using a spreadsheet program. They establish lines of best fit and draw conclusions using their graphs.


