Curated OER
Observing Weather
Students investigate the weather by reading children stories. In this weather observation lesson, students read Cloudy With a Chance of Meatballs and several other stories about weather before they create a KWL chart....
Curated OER
Hands-On Weather Data Collecting
Fifth graders study weather in their community, in the United States, and around the world. They use thermometers, the beaufort wind scale, and simple weather symbols to measure and record the weather outside their school. They also look...
Curated OER
Weather Watchers
Second graders discuss what weather is and list words that can be used to describe weather. In this science lesson, 2nd graders develop symbols for each type of weather and record the weather for two weeks at the same time and the same...
Curated OER
Water Cycle, Weather, and Climate
Eighth graders investigate the water cycle and its processes. They examine temperature and precipiation data to classify climate of ten cities. They then create a climate map of the world.
Curated OER
Mapping West Virginia
Fourth graders explore West Virginia. In this Unites States geography lesson, 4th graders discuss the type of land and the cities in West Virginia. Students create two overlays, with transparencies, that show the natural land and the...
Curated OER
Weather Forecasting: From Then to Now
Eighth graders review the history of weather forecasting. In this earth science lesson, 8th graders identify the different tools used in forecasting weather. They explain why it's important to know the weather.
Curated OER
Brochure Writing: Severe Weather Patterns
Students observe weather patterns. They reserach important facts about severe weather. Using computer technology, students create a detailed brochure explaining six severe weather patterns.
Curated OER
What Is A Map?
Students become familiar with a map and what it is used for and become familiar with school and home surroundings. With the familiarity of their surroundings they discover that maps can be created to help them with directions and how to...
Curated OER
Hide and Seek with Bones: A Mapping and Scaling Comparison
Young scholars examine and simulate how paleontologists map objects. They hide and find objects using a grid to map the objects' placements.
Curated OER
Wind Mapping With Bubbles
Students identify wind direction by using bubbles. In this weather lesson, students use a small container of bubbles and a map of their house to create a wind map. Students blow bubbles and note the general direction the bubbles are...
Curated OER
Weather Reporter
Fourth graders explore the components of a weather map, mark cities on the map and place the appropriate temperatures and weather conditions occurring in the cities on the weather map created.
Curated OER
A Comparison of Cloud Coverage Over Africa
Students use a NASA satellite data to contrast amounts of cloud coverage over different climate regions in Africa. They explore how Earth's major air circulations affect global weather patterns, and relate to local weather patterns.
Curated OER
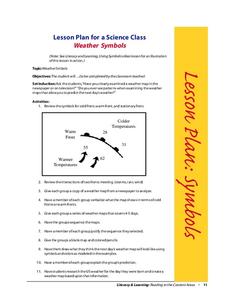
Weather Symbols
Students study weather symbols. In this weather symbols lesson, students review the symbols for cold, warm, and stationary fronts. Students use a weather map to study the weather symbols, complete a weather illustration and prediction...
Curated OER
Weather
Students describe the weather and temperature in the city, state, and/or country in which they live during the 4 seasons.
Curated OER
Make Your Own "Weather" Map
High schoolers create their own "weather" map using data from x-ray sources. They analyze and discuss why it is important to organize data in a fashion in which is easy to read. They compare and contrast different x-ray sources using a...
Curated OER
Will There Be a White Christmas This Year?
Young scholars examine historical weather data, and create map and color key that illustrates the likelihood of a white Christmas in different locations across the United States.
Curated OER
Geography of Our Environment
Students explore geographical elements. In this geographical elements lesson, students create a map showing the geographical elements in their area. Students take pictures of these elements to glue to their map and present it to the class.
Curated OER
Homes Around the World
Learners investigate houses and homes from around the world and create a map collage. They compare how the homes are similar and different and why houses match the weather and geography.
Curated OER
Weather
Fourth graders study a map and locate cities, read information and create a chart. In this weather lesson plan students place appropriate weather information on a map and write a script using their information to relay the weather...
Curated OER
Clouds and Your Weather
Seventh graders identify clouds and the weather associated with them. They use informational articles and personal weather observations to learn about the relationships between weather fronts and clouds.
Curated OER
Comparing the Effects of El Nino and La Nina
Students examine the differences between an El Nino and La Nina year. In this investigative lesson students create maps and graphs of the data they obtained.
Curated OER
A Comparison Study of Water Vapor Data to Precipitation over North America
Students use NASA satellite data to compare water vapor over the United States. For this data analysis lesson students use an Excel spreadsheet to map their data.
Columbus City Schools
What is Up Th-air? — Atmosphere
Air, air, everywhere, but what's in it, and what makes Earth's air so unique and special? Journey through the layers above us to uncover our atmosphere's composition and how it works to make life possible below. Pupils conduct...
NASA
Hurricanes and Hot Towers with TRMM
Take cover because a wild presentation on hurricanes is about to make landfall in your classroom! An outstanding PowerPoint presentation is the centerpiece of this instructional activity. Not only does it provide information and...


