National WWII Museum
The Red Ball Express: Statistics as Historical Evidence
Historians use all kinds of information to make conclusions ... including statistics. Young scholars examine how two historians evaluate The Red Ball Express—a supply line staffed primarily by African Americans—using numbers. The...
Global Oneness Project
A Day in the Life
We often see other countries depicted in movies, but getting a close look at a typical day in the life of a young person from another country isn't as common. Give your pupils such a look with a resource that helps class members...
EngageNY
Presenting a Summary of a Statistical Project
Based upon the statistics, this is what it means. The last instructional activity in a series of 22 has pupils present the findings from their statistical projects. The scholars discuss the four-step process used to complete the project...
Curated OER
Statistics Problems
In this statistics worksheet, 3rd graders answer questions about different graphs including bar graphs, picture graphs, line graphs, and more. Students complete 20 multiple choice questions.
Curated OER
Statistics
In this statistics worksheet, 9th graders solve and complete 10 various types of multiple choice problems. First, they determine the mean number of miles per day that were completed. Then, students determine the data set that has a...
Curated OER
Statistics - Central Tendency
In this statistics worksheet, students solve and complete 13 different problems that include creating various box-and-whisker plots. First, they write a definition for mean, median, mode and range. Then students explain how to determine...
Balanced Assessment
Presidential Popularity
Media often misrepresent data and statistics to their advantage. This lesson asks scholars to analyze an article with misleading statistics. They use margin of error and mean data in their studies. Once they complete their analysis,...
Curated OER
Self-Injury Awareness Day
In this Self Injury Awareness Day worksheet, learners complete activities such as reading a passage, phrase matching, fill in the blanks, correct words, multiple choice, spelling, sequencing, scrambled sentences, writing questions,...
Curated OER
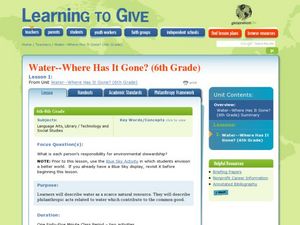
Water--Where Has It Gone?: Earth Day
Students explore the concept of philanthropy. In this environmental stewardship lesson, students consider the plight of water as they consider water use and distribution. Students listen to an excerpt from The Well and consider...
EngageNY
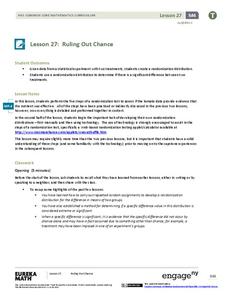
Ruling Out Chance (part 1)
What are the chances? Teach your classes to answer this question using mathematics. The first part of a three-day lesson on determining significance differences in experimental data prompts learners to analyze the data by...
Global Oneness Project
Living with Less Water
Did you know that California produces two thirds of the fruits and nuts consumed in the United States? That it produces almost one third of the vegetables? Did you know that scientists warn that California is facing the onset of a...
Curated OER
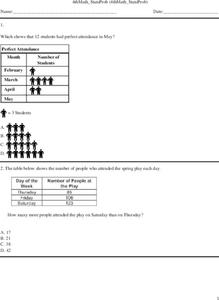
Fourth Grade Math Practice-Statistics
For this 4th grade statistics worksheet, learners complete a total of 7 problems. An answer key is provided; problems are related to statistics.
Curated OER
Probability and Statistics
Students reason mathematically as they solve problems dealing with probability of an even occurring. In this probability lesson, students differentiate between different rankings of candidates running for leadership. They identify...
Curated OER
Scatter Plots
For this statistics worksheet, 11th graders analyze different scatter plot graphs for positive, negative and no correlation. They graph their data and analyze it using scatter plots.There is 1 question with an answer key.
Curated OER
Math for Fourth Grade: Statistical Charts
In this math for fourth grade statistical charts worksheet, 4th graders answer 7 multiple choice questions in standardized test format about data, charts and graphs.
Curated OER
Drive the Data Derby
Three days of race car design and driving through the classroom while guessing probability could be a third graders dream. Learn to record car speed, distances traveled, and statistics by using calculation ranges using the mean, median,...
EngageNY
Ruling Out Chance (part 3)
Pupils analyze group data to identify significant differences. They use simulation to create their own random assignment data for comparison.
Howard Hughes Medical Institute
Central Dogma and Genetic Medicine
Scientists work every day to find solutions to genetic diseases. Scholars learn about the process of gene sequencing, mutations, and the results. They explore genetic diseases and therapies to intervene and help and, through case...
Curated OER
Iditarod-Statistics and Rates
Students analyze data from the Iditarod race. In this data analysis lesson, students work in pairs to analyze data and answer several questions such as, "what is the difference in the rate of travel" and "how much more prize money does...
National Security Agency
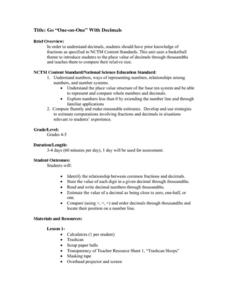
Go One-on-One with Decimals
Shoot and score with three basketball-themed lessons about decimals. Young mathematicians compare game statistics, make trash can hoops, and play a data spinner game to practice identifying digits and values within decimal numbers.
Curated OER
The Vietnam Lotteries
In this probability and statistics worksheet, students examine the “fairness” to the Vietnam draft lottery system by constructing box plots of each of the twelve months using data provided. The three page worksheet contains one...
Curated OER
Animal Issues: Let's Talk Turkey
Thanksgiving means an untimely demise for thousands of turkeys every year. This turkey Q and A provides nine questions bringing facts and statistics of turkey consumption to the discussion table. There is an answer key that provides full...
Curated OER
Investigation - Design Your Own Spinner
Seventh graders use ideas of uncertainty to illustrate that mathematics involves more than exactness when dealing with every day situations. The main standard of this lesson is statistics and probability.
Curated OER
Probability Of One Event
Students investigate the concept of probability. They use example problems in order to measure the likelihood of various outcomes. The lesson includes dialogue to be used by the teacher during direct instruction. They also use class...


