Curated OER
Religious Book Sales Climb
In this analyzing data worksheet, students review a graph from the USA Today. Students study the graph and answer four questions about the graph. There are also two extension questions included.
Curated OER
Creating a Spreadsheet and Graph
Young scholars create graphs in Excel. In this spreadsheet instructional activity, students input data into spreadsheet cells then use the graphing feature of the Excel program to produce colorful graphs of the data. The directions to...
Curated OER
A Picture's Worth a Thousand Words
Young scholars analyze the numbers of male vs female administrators and teachers from their school. In this gender equality lesson plan, students use school yearbooks from the 1950's threw present to count how many male vs. female...
Center of Excellence for Science and Mathematics Education
A Sick Astronaut
Aspiring astronauts graph, interpret, and analyze data. They investigate the relationship between two variables in a problem situation. Using both graphic and symbolic representations they will grasp the concept of line of best fit to...
Curated OER
Statistics
In this statistics worksheet, 9th graders solve and complete 10 various types of multiple choice problems. First, they determine the mean number of miles per day that were completed. Then, students determine the data set that has a...
Curated OER
Valentine Hearts Investigation
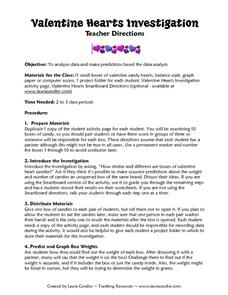
Students practice analyzing data and making predictions. For this 2nd - 3rd grade lesson plan, students investigate and compare data gathered using boxes of valentine candy hearts. Students examine the different boxes of candy...
Curated OER
All About Graphs
Students practice organizing data by creating graphs. In this statistics lesson, students survey the class about favorite colors and create a bar graph using the data. Students complete a test based on pet and animal statistics.
Curated OER
200 Years and Counting: How the U.S. Census Tracks Social Trends
Students examine the process of census taking in the United States. For this "200 Years and Counting" lesson, students examine the data collection process, look at an example of a census form, analyze data, and learn what the information...
Curated OER
Graphing the Forecast-Line Graph or Bar Graph?
Learners explore bar and line graphs. In this data collection, graphing, and weather lesson, students compare bar and line graphs and discuss which type of graph would be most appropriate for displaying a ten day weather forecast....
Curated OER
Energy Efficient Homes
Students observe and gather data from a model simulated home. In this efficiency lesson students examine the factors that influence energy efficiency, complete a lab activity then draw conclusions from their data.
Curated OER
You Be The Census Taker
Students interpret information from an excerpt of the 1870 U.S. Census and compare that data to economic data they collect about local businesses in their own community. Students then evaluate how closely linked their community's economy...
Curated OER
Water Resources
Students study water resources that are important to the people of North American and Africa. They use satellite images and data to explore how human actions can degrade, improve, or maintain water resources. They analyze and interpret...
Curated OER
Graphing the Weather
Fourth graders predict the weather for their area using simple weather instruments. They take readings for a month during a season and graph their results. Students describe weather patterns based on their data and predict future weather...
Curated OER
Designing a Germination Experiment
Students explore botany by participating in a seed experiment. In this plant nutrition lesson, students define several science experiment vocabulary terms like observation, treatment, and replicate. Students utilize soaked seeds in a...
Curated OER
Shaky New Zealand
Students explore geography by answering study questions in class. In this plate tectonics lesson, students identify the earthquake data concerning the country of New Zealand and answer questions regarding the data. Students identify...
Curated OER
What Influences Reaction Rate?
Learners study reaction rates, what determines how fast a reaction happens and how the chemical changes occur. In this reactions lesson students complete a lab where they use Alka-Seltzer to observe reaction rate and create a graph with...
Curated OER
Where's The Beef
Students create and conduct a survey in the community to evaluate the demographics of vegetarians in the community. They compile data, create graphs, calculate percentages, and draw conclusions about the survey data. Students create an...
Curated OER
Adopt a City-Winter Weather
In weather worksheet, students use an on line site to collect weather data. They create 10 different weather scenarios using a temperature and humidity slider. They includethe temperature, relative humidity and weather conditions and...
Curated OER
Populations and Life Cycles
Students explore biology by researching ocean statistics. In this data analysis lesson, students conduct a snail examination experiment utilizing live pouch snails. Students collect data about the snails over the course of six weeks and...
Curated OER
What Did It Cost 100 Years Ago?
Students compare prices of good across the century in order to introduce the topic of inflation. They undertand the concepts of inflation and Consumer Price Index (CPI), use online calculators to figure the approximate cost of goods...
Curated OER
Probability
Second graders experiment with probability. In this probability lesson plan, 2nd graders pick colored beans from a bag to find the chance of getting different colors. They make fair and unfair spinners and record the data after spinning...
Curated OER
Central Tendency
In this central tendency learning exercise, 8th graders solve 10 different problems that include determining the mean, mode, and median of various situations. First, they prepare a frequency distribution with a class interval for the...
Curated OER
Watch the Sky: Observing Clouds and Patterns
Students observe clouds outside of the classroom. In this weather activity, students investigate and record the clouds above their classroom everyday for three weeks. The students then analyze their data and discuss what causes specific...
Curated OER
Introduction to Engineering Information Technology
Students demonstrate knowledge of information sharing skills by discussing each step with their group members. They demonstrate application of information sharing skills by working with a group to share specific pieces of data with...
Other popular searches
- Data, Census, & Statistics
- Data Collection
- Collecting Data
- Graphing Data
- Data Analysis Pictograph
- Categorical Data
- Data Tables
- Databases
- Data Analysis Lesson Plans
- Data Management
- Data Analysis Graphing
- Access Database


