Curated OER
Comparing Forecasts To Today's Weather
First graders compare forecasts to today's weather. They gather information about today's weather and record it on a chart. Students record information on the weather and discuss the importance of forecasts.
Curated OER
Weather Instruments
Students research weather instruments. In this weather instructional activity, students use the Global Climate DVD and take notes on weather instruments. Students answer multiple choice questions on a worksheet.
Curated OER
THIS WEEK'S WEATHER
First graders create a picture graph representing their town's weather for one week.
Curated OER
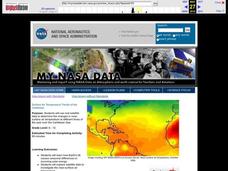
Surface Air Temperature Trends of the Caribbean
Students investigate the seasonal changes to sea surface and near-surface air temperatures near the equator. They use actual satellite data to track and graph the differences in air and sea temperatures during different seasons in the...
Curated OER
Environment: Wild Wind Direction
Students examine the different types of wind patterns. Using common materials, they construct weather vanes to measure and record wind direction over a two-week period. After analyzing the data, they draw conclusions about the...
Curated OER
Weather Station
Students create their own barometer, precipitation, rain gauge, anemometer, and more with their weather stations. In this weather station lesson plan, students access on line websites on how to make their own weather tools.
Curated OER
Crimes on the Great Lakes
Students solve simulated crimes using real-time online information. They research data on items such as ship tracking through GPS, lake conditions, and weather systems. They also collect information about invasive plant and animal...
Curated OER
Circle the Earth - Explore Surface Types on a Journey around Earth
Students use CERES percent coverage surface data with a world map in locating landmasses and bodies of water at Earth's Equator.
Curated OER
Forecast Fever
Ninth graders investigate what high-tech tools are used to gather weather data and make weather forecasts. They view a video and a PowerPoint presentation, and conduct research on a cloud chart website. Students make local weather...
Curated OER
Weather Or Not
Students use the internet to find pen pals to share in their weather experiment. Individually, they research the high and low temperatures for cities within the United States and email the results to their pen pal. They also develop a...
Curated OER
Weather Words
Third graders gather together as a class and share any facts or words about the science unit "Weather Elements". They listen to the story/poem, "Listen to the Rain" and recall any weather related words from the story.
Curated OER
Range, Mean, Median, and Mode
Eighth graders find the range, median, mean, and mode of a data set. In this finding the range, median, mean, and mode of a data set lesson, 8th graders collect data about the high and low temperature for 10 different cities. ...
Curated OER
Bar Graphs
Students perform operations and graph their data using charts and bar graphs. In this algebra lesson, students follow specific steps to make a bar graph. They create a survey about people favorite things and plot their data from the...
Curated OER
Does Cloud Type Affect Rainfall?
Student uses MY NASA DATA to obtain precipitation and cloud type data. They create graphs of data within MY NASA DATA. They compare different cloud types as well as precipitation types. They describe graphs of the precipitation and cloud...
Curated OER
Climate Change
Students compare weather data and draw conclusions. For this climate change lesson plan, students determine whether data collected over a period of ninety years shows a warming trend.
Curated OER
Backyard Birds: Who's Who Out There?
Students practice techniques of field observation and data-gathering while studying local bird population, describe ecosystem as complex combination of elements, which can affect or be affected by each other, and determine effects of...
Curated OER
Graphics Creation and Statistical Interpretation: Relating Local Economics and the Global Environment
Students apply statistics, and graphical interpretation to economics, the environment and populations. In this statistical instructional activity students construct graphical displays and classify data.
Curated OER
Studying Snow and Ice Changes
Students compare the change in snow and ice over a 10 year period. In this environmental science lesson, students use the live data on the NASA site to study and compare the monthly snow and ice amounts on a map of the entire...
Curated OER
Seasonal Cloud Cover Variations
Learners, in groups, access data from the NASA website Live Access Server regarding seasonal cloud coverage and the type of clouds that make up the coverage. They graph the data and make correlations between types, seasons and percentages.
Curated OER
Filling Up
In this filling up worksheet, students calculate the E85 per gasoline-gallon equivalent price to the E85 price per gallon to complete a chart of "alternative fuel". They use the data along with the price per gallon of gasoline to plot...
NASA
The Effects of Sunspots on Climate
In this sunspots and climate change learning exercise, learners use a diagram of a tree stump and its rings to determine the age of the tree. They use sunspot data from the internet and they construct an Excel spreadsheet to compare the...
Curated OER
Satellite Sense
Students look at data to understand how it is interpreted by scientists. In this satellite sense lesson, students complete worksheets based on radar and satellite images. Students work in groups of two to diagram a landform.
Curated OER
What Are My Chances?
Students calculate probability. In this lesson on probability, students use given data to calculate to chances of a given event occurring. Many of the calculations in this lesson are applicable to daily life.
Curated OER
Temperature in the Sun or Shade of the Desert
Third graders use thermometers to measure the air temperature in several
places around the school and then return to the classroom to record the data. They create a bar graph and discuss their findings about the air temperature in the...


