Illustrative Mathematics
Weather Graph Data
Teaching young mathematicians about collecting and analyzing data allows for a variety of fun and engaging activities. Here, children observe the weather every day for a month, recording their observations in the form of a bar graph....
National Wildlife Federation
The Tide is High, but I’m Holding On… Using ICESat Data to Investigate Sea Level Rise
Based on the rate of melting observed from 2003-2007 in Greenland, it would take less than 10 minutes to fill the Dallas Cowboys' Stadium. The 17th lesson in a series of 21 has scholars use the ICESat data to understand the ice mass...
Chicago Botanic Garden
Plant Phenology Data Analysis
Beginning in 1851, Thoreau recorded the dates of the first spring blooms in Concord, and this data is helping scientists analyze climate change! The culminating instructional activity in the series of four has pupils graph and analyze...
PBS
Investigating Daily and Seasonal Weather
Talking about weather isn't just for making conversation. Young scientists gather evidence from an interactive activity to make connections between daily and seasonal weather. They analyze data from different areas and compare the...
California Academy of Science
California's Climate
The United States is a large country with many different climates. Graph and analyze temperature and rainfall data for Sacramento and Washington DC as you teach your class about the characteristics of Mediterranean climates. Discuss the...
Polar Trec
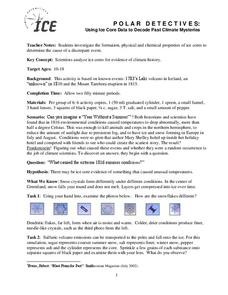
Polar Detectives: Using Ice Core Data to Decode Past Climate Mysteries
How does examining an ice core tell us about weather? Learners set up and explore fake ice cores made of sugar, salt, and ash to represent historical snowfall and volcanic eruptions. From their setups, scholars determine what caused the...
National Wildlife Federation
Get Your Techno On
Desert regions are hotter for multiple reasons; the lack of vegetation causes the sun's heat to go straight into the surface and the lack of moisture means none of the heat is being transferred into evaporation. This concept, and other...
Curated OER
Deep Convective Clouds
Students observe clouds. In this deep convective clouds lesson plan, students analyze cloud data recorded over one month and draw conclusions based on results. Students predict "Thunderstorm Season" and prepare to defend their...
Teach Engineering
Backyard Weather Station
Challenge young meteorologists to apply their knowledge of weather to build their own weather stations. The resource provides the directions to build a weather station that contains a wind vane, barometer, thermometer, and rain...
NASA
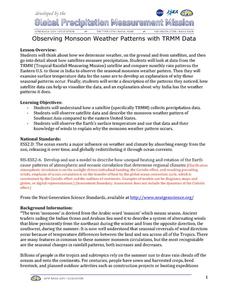
Observing Monsoon Weather Patterns with TRMM Data
Follow a fabulous slide show on how monsoons form and how satellite technology is being used to observe the phenomena, explaining why they occur. Afterward, visit the TRMM (Tropical Rainfall Measuring Mission) website to access actual...
Captain Planet Foundation
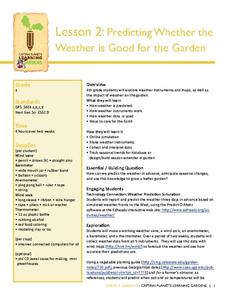
Predicting Whether the Weather is Good for the Garden
Can your class predict the weather? Show them how they can come close with a lesson about creating weather instruments, including weather vanes, barometers, wind socks, anemometers, and thermometers. Kids research weather patterns and...
NASA
Erosion and Landslides
A professional-quality PowerPoint, which includes links to footage of actual landslides in action, opens this moving lesson. Viewers learn what conditions lead to erosion and land giving way. They simulate landslides with a variety of...
Chicago Botanic Garden
Weather or Not
What is the difference between weather and climate? This is the focus question of a activity that takes a deeper look at how weather data helps determine climate in a region. Using weather and climate cards, students decide...
Discover Earth
Weather Stations
Transform your classroom into a fully functioning weather station with this series of hands-on investigations. Covering the topics of temperature, precipitation, wind patterns, and cloud formation, these activities engage young...
Chicago Botanic Garden
Historical Climate Cycles
What better way to make predictions about future weather and climate patterns than with actual climate data from the past? Young climatologists analyze data from 400,000 to 10,000 years ago to determine if climate has changed over...
NASA
Write the Book on Weather Metrics
It's not easy to measure the weather. Pupils learn about what all weather has in common—the atmosphere. Scholars discover how a meteorologists must be able to measure aspects of the atmosphere and decipher the data. They then create a...
Curated OER
Graphing and Analyzing Biome Data
Students explore biome data. In this world geography and weather data analysis lesson, students record data about weather conditions in North Carolina, Las Vegas, and Brazil. Students convert Fahrenheit degrees to Celsius degrees and use...
Curated OER
Creating Climographs
Students use satellite data to compare precipitation and surface temperatures on different islands. In this satellite lesson students create graphs and explain the differences between weather and climate.
Curated OER
How Does Your Garden Grow? Discovering How Weather Patterns Affect Natural Cycles
For the warm-up in this cool climate lesson, you will need to click on "Mapping" and then "US Mapping" once you arrive at NOAA's "US Climate at a Glance" page. Earth science explorers realize that 2012 was a warm winter for us. They read...
Curated OER
Cold, Clouds, and Snowflakes
Young scholars explore satellite data and graphing. In this weather data analysis math and science lesson plan, students analyze NASA satellite data to draw conclusions about geographical areas where precipitation might have happened....
K20 LEARN
The Parched Plains: Weather And Climate
How do meteorologists differentiate between droughts and dry spells? Introduce the concepts of weather forecasting and prediction with an insightful research-based lesson plan from the K20 series. Partners synthesize individual research...
Curated OER
The Weather Page: Comparing Data
Students recognize the different types of data on the weather page of USA Today. In this weather lesson, students compare weather data comparative and superlative forms of adjectives. Students locate 10 pieces of information in the data...
Space Awareness
The Climate in Numbers and Graphs
Weather versus climate: weather relates to short time periods while climate averages the weather of a period of many years. Scholars learn about average temperature and precipitation in various climate zones and then apply statistics...
Chicago Botanic Garden
Recent Weather Patterns
Decide whether weather is changing! A two-part activity first challenges classes to review the differences between weather and climate. Once finished, individuals then analyze historical data to determine if climate change is happening...


