Curated OER
Using Solar Energy
Students experiment to determine the effect of solar energy on the temperature of water. In this renewable resources lesson, students measure the temperature of water in a flask that is exposed to sunlight. They relate their results...
NASA
Nasa: Using Radiosonde Data From a Weather Balloon Launch
This lesson plan allows students to learn about the layers of the atmosphere and to learn how to graph real atmospheric data.
NOAA
Noaa: National Climatic Data Center
Search the world's largest archive of weather data or click on the links to learn about extreme weather. Look up weather information about your city or town.
Illustrative Mathematics
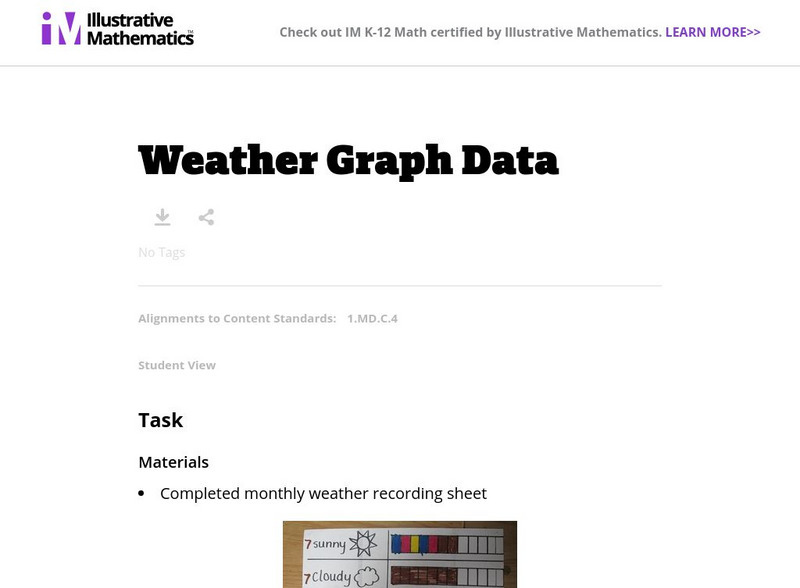
Illustrative Mathematics: Weather Graph Data
The purpose of this task is for students to represent and interpret weather data, as well as answer questions about the data they have recorded. Student worksheets and recording sheet are included.
Center for Innovation in Engineering and Science Education, Stevens Institute of Technology
Ciese: Weather Scope: An Investigative Study of Weather and Climate
The activities in this comprehensive weather unit are designed for Grade 6 and up. Learners will use real time data from around the world to conduct an investigation about weather and climate.
Other
Bureau of Meteorology: About Weather Station Data
A page that can help select which weather data from the Bureau's observation station would be helpful in predicting weather patterns. "It briefly provides information about where you may find a Bureau weather station, what observations...
National Snow and Ice Data Center
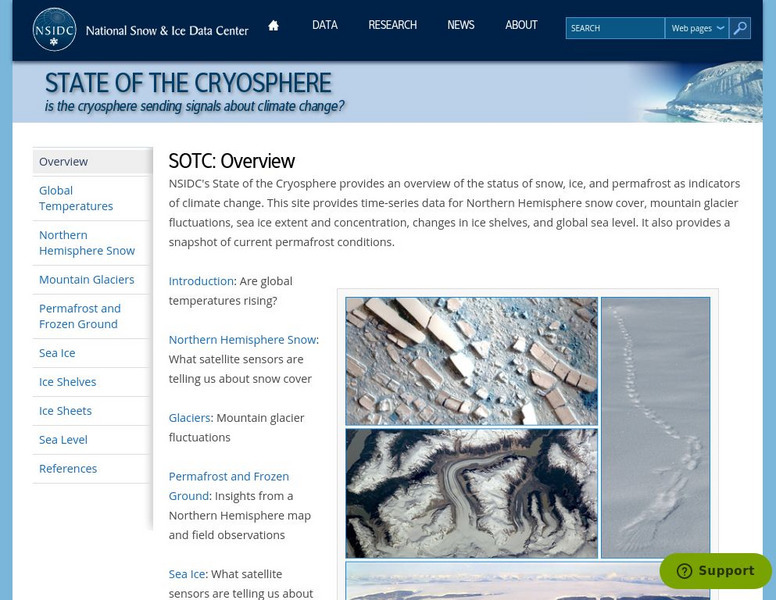
National Snow and Ice Data Center: State of the Cryosphere
This site provides thorough information about the status of snow and ice as indicators of climate change. This site has links to introductory information about the cryosphere, as well as info on specific area weather patterns.
Center for Innovation in Engineering and Science Education, Stevens Institute of Technology
Ciese: Wonderful World of Weather Project
If you're studying the weather, this is an excellent project for students to develop their understanding of how weather is measured. They will use real time data from their location as well as from around the world to learn about weather...
NOAA
Noaa: National Climatic Data Center: Groundhog Day
Find background about Groundhog Day and the folklore involved. Look through the charts that show how closely Punxsutawney Phil's predicitions align with the actual weather.
PBS
Pbs Learning Media: Daily and Seasonal Weather: Interactive Lesson
Students investigate the relationship between daily weather and seasonal weather. Students will read about how weather data is collected, then interpret examples of weekly and monthly weather data to find seasonal patterns. Visual...
Other
Space weather.com
Want to know what the current weather conditions are in space? Find everything here you may want to know about the latest solar flares, sunspots, asteroids and more. Site also includes essential web links to quench any user's thirst for...
University Corporation for Atmospheric Research
Ucar: Get the Picture Severe Weather
Students review graphs and charts of severe weather data then answer "True and False" questions about the content conveyed.
Better Lesson
Better Lesson: Comparing the Weather
In order to meet Common Core standards, 2nd graders need to be able to interpret data to solve problems. This lesson provides practice in this area. Included in this lesson are a printable temperature chart and a video of second graders...
Climate Literacy
Clean: Investigating Weather and Climate With Google Earth
In this activity, learners will investigate the change in global temperature by analyzing data on Google Earth for 13 different cities. Students will then interpret the climate patterns for those cities to make conclusion about the...
Alabama Learning Exchange
Alex: Charting the Weather
During this instructional activity, students will gather data from temperature and water gauges set up on the playground to learn about weather patterns. Then students will build a spreadsheet with data related to temperature, wind...
Other
Classzone: Weather Forecasters Use Advanced Technologies [Pdf]
An excerpt from an earth science textbook. The chapter shown here covers concepts about how weather data is collected, displayed and how meteorologists forecast fronts and storms.
NASA
Nasa Earth Observatory: Should We Talk About the Weather?
Discover how scientists use the BOREAS to gather data such as heat, carbon dioxide, water vapor, and more to see what role these levels have on climate changes.
CK-12 Foundation
Ck 12: Third Grade Science: Earth Science: Weather Forecasting
[Free Registration/Login may be required to access all resource tools.] Read about how meteorologists predict the weather and how technology and computers are used to forecast the weather. Also discusses what weather maps show us.
Center for Innovation in Engineering and Science Education, Stevens Institute of Technology
Ciese Real Time Data Projects: Air Pollution: Tracking Ozone
In this activity, you will monitor the levels of ozone in Trenton, New Jersey for several days and make final decisions about the influence of weather on ground level ozone.
University Corporation for Atmospheric Research
Ucar: Unidata: Conventional Weather Reports
This resource talks about how the stations report their information. Several examples of how different universities compile the information are provided.
Center for Innovation in Engineering and Science Education, Stevens Institute of Technology
Ciese: Air Pollution: What's the Solution?
Outdoor air pollution poses a major threat to human health and threatens the ozone layer. Students will examine real time weather data in this extensive unit to learn how air quality is measured, its health impact on at-risk populations,...
NOAA
Noaa: Cpc: Regional Climate Maps
Provides large colorful maps of climate data about each continent for the current week, month, or previous quarter.
Geographypods
Geographypods: Weather and Climate Graphing It!
Explores the difference between weather and climate and how they are measured. Students will complete activities and construct a climate graph from raw data. They will also learn about the physical structure of the rainforest, its...
Other
Rutgers Marine & Coastal Sciences: Cool Classroom
Students and teachers can explore the work of marine scientists and observe the ocean from their computers. Learn about Rutgers Coastal Ocean Observation Laboratory, discover why oceanography is important, and see what life is like in...


