Curated OER
The Air Up There
In this data collection and analysis activity, learners observe and graph the weather conditions during one school week, then calculate the average weather temperature. Extensions are included.
Curated OER
Hurricane Frequency and Intensity
Students examine hurricanes. In this web-based meteorology lesson, students study the relationship between ocean temperature and hurricane intensity. They differentiate between intensity and frequency of hurricanes.
Curated OER
Jupiter's Weather Forecast
Students read information about Jupiter and the planet's weather. In this Jupiter weather lesson plan, students read information about Jupiter's weather. Students study a chart about the weather on Earth and Jupiter. Students read a...
Curated OER
Interpreting Weather Station Symbols
In this science worksheet, students look at the symbols on the map and make interpretations about temperature or other conditions to master the weather knowledge in the four problems.
Curated OER
Weather Conditions During the Fall Monarch Migration
Young scholars keep detailed weather records (temperature, wind direction, predipitation) during the fall migration of the monarch butterfly. They analyze their data and create a chart or graph depicting the data. Finally they relate the...
Curated OER
El Nino Lesson
Students compare graphs of weather occurrences. In this environmental lesson plan, students will being using the website to gather weather related information for a certain time period. The students will then graph the data that will be...
Curated OER
Reading Weather Maps
Fourth graders the symbols that are used on weather maps. They develop five day forecasts based on information they gather from weather maps in the newspaper and on the Internet.
Curated OER
Investigation 8 - Weather Forecasts
Fourth graders examine how to predict and evaluate weather forecasts. Discuss with students why weather predictions are important to us. Ask them what people do after they hear a forecast. They brainstorm reasons forecasts are important...
Curated OER
What is Weather?
In this weather learning exercise, students photograph and record the weather conditions for a week. Then they list the types of clouds observed and the weather conditions they noted associated with each cloud type. Students also write a...
Curated OER
Understanding Weather Maps and the Importance of StormT
Young scholars explain how storm tracking is important to understanding sources of acid rain pollution. The read and explain a weather map. They set up plastic or glass collection container for rain in an open area away from buildings...
Curated OER
Measuring and Observing Weather Phenomena
In this weather worksheet, students take the temperature and record data over a period of time of 1 month. Students then make a spreadsheet of their data and include variables that contribute to the weather.
Curated OER
March of the Polar Bears: Global Change, Sea Ice, and Wildlife Migration
Students study global change and how these changes impact wildlife. For this polar bears lesson students analyze maps and data to understand climate change.
Curated OER
Creating a Thematic Map Using S'COOL Data
Students observe weather patterns, collect data, and make a weather predictions for various locations on a map.
Weather Bug
WeatherBug
Exploring the weather has never been more intriguing! Whether you are looking for a quick glance at the 10-day forecast, trying to figure out if lightning is heading your way, or wondering what the pollen count is, you will find out...
Chicago Botanic Garden
Climate Change Around the World
Look at climate change around the world using graphical representations and a hands-on learning simulation specified to particular cities around the world. Using an interactive website, young scientists follow the provided directions to...
Chicago Botanic Garden
Historical Climate Cycles
Ice core samples give scientists access to climates of old—those from more than 800,000 years ago. Through an analysis of various temperature graphs from ice cores, tree rings, and weather stations, scholars compare historical climates...
Virginia Department of Education
Heat Loss from a Fur-Insulated Animal
How do animals adapt to weather changes? Provide your class with the ability to understand adaptations and body temperature as they participate in this hands on experiment, using fake fur and hot water. Pupils collect data and analyze...
Science Geek
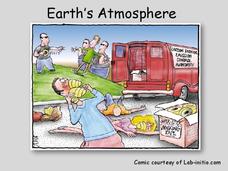
Earth's Atmosphere
Ozone gas absorbs the harmful UV-B rays and helps protect humans. An informative presentation begins with the layers of the earth's atmosphere, the pressure and temperature in each of the layers, the ozone layer, the ozone cycle, and the...
Curated OER
Weathervanes in the Wind
Students investigate wind and weather by creating a weathervane. In this environment lesson, students identify the purpose of a weathervane and observe weathervanes in action on their campus. Students create a weathervane and decorate...
Curated OER
Wether Prediction
Students participate in a online weather course. They accurately forecast the weather and work through a series of four lessons. In addition, they present a weather forecast in front of the class, just like the weather people on...
Curated OER
Beary O'Mometer Learns About Careers In Meteorology
Young scholars explore the field of meteorology. In this meteorology lesson, students explore weather-related careers as they research the field of study as well as various weather concepts. Young scholars interview meteorologists, write...
Curated OER
Weather In The World
Students investigate the weather in different places in the world. In this algebra lesson, students use technology to gain an understanding of how to study integers. They add and subtract integers on a number line.
Curated OER
Min-Max temperatures
Young scholars investigate data of minimum and maximum weather temperatures over the period of one week. They answer guided questions in order to establish comprehension of interpreting the data.
Curated OER
Will There Be a White Christmas This Year?
Students examine historical weather data, and create map and color key that illustrates the likelihood of a white Christmas in different locations across the United States.
Other popular searches
- Weather Data
- Recording Weather Data
- Collecting Weather Data
- Weather Atmospheric Data
- Graphing Weather Data
- Analyzing Weather Data
- Collect Weather Data
- Math Data Graph Weather
- Weather Data Projects
- Gathering Weather Data
- Weather Log Data Sheets


