Illustrative Mathematics
Weather Graph Data
Teaching young mathematicians about collecting and analyzing data allows for a variety of fun and engaging activities. Here, children observe the weather every day for a month, recording their observations in the form of a bar graph....
Curated OER
TV Weather Announcers
Elementary schoolers collect and record weather data for their local area using data from newspapers, Web sites, and television reports. The read and record data daily, and groups prepare a presentation on their findings for the entire...
Curated OER
Student News And Weather Channel
Fabulous! Your 5th graders should love this project. As an ongoing activity throughout the year students use temperature probes to record outside temperature and then document their data using spreadsheets. They use their weather data...
Chicago Botanic Garden
Plant Phenology Data Analysis
Beginning in 1851, Thoreau recorded the dates of the first spring blooms in Concord, and this data is helping scientists analyze climate change! The culminating instructional activity in the series of four has pupils graph and analyze...
Chicago Botanic Garden
Weather or Not
What is the difference between weather and climate? This is the focus question of a activity that takes a deeper look at how weather data helps determine climate in a region. Using weather and climate cards, students decide...
Teach Engineering
Backyard Weather Station
Challenge young meteorologists to apply their knowledge of weather to build their own weather stations. The resource provides the directions to build a weather station that contains a wind vane, barometer, thermometer, and rain...
Curated OER
Weather Watchers
Students identify basic weather instruments and how they are used to record weather data. Students define several vocabulary terms as stated in lesson. Students use basic instruments to record weather data in their area. Students use the...
Curated OER
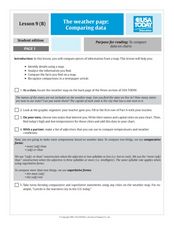
The Weather Page-Comparing Data
Students examine weather patterns in the United States. In this weather lesson, students use a United States map to identify high and low temperatures in two states. Students compare the data and record their findings onto a chart.
Curated OER
Deep Convective Clouds
Students observe clouds. In this deep convective clouds lesson plan, students analyze cloud data recorded over one month and draw conclusions based on results. Students predict "Thunderstorm Season" and prepare to defend their...
NASA
Write the Book on Weather Metrics
It's not easy to measure the weather. Pupils learn about what all weather has in common—the atmosphere. Scholars discover how a meteorologists must be able to measure aspects of the atmosphere and decipher the data. They then create a...
Curated OER
The Weather Page: Comparing Data
Students recognize the different types of data on the weather page of USA Today. In this weather lesson, students compare weather data comparative and superlative forms of adjectives. Students locate 10 pieces of information in the data...
Curated OER
Weather instruments
Students explore weather instruments. In this weather lesson plan, students make rain gauges, anemometers, and barometers following the instructions given in the lesson plan. Students set up a weather station using their instruments and...
Curated OER
Weather Reporter
Fourth graders generate an oral presentation on the weather. In this weather lesson, 4th graders watch the weather for a week and record the data on a chart. Students give a weather report at the end of the week.
Curated OER
How Does Your Garden Grow? Discovering How Weather Patterns Affect Natural Cycles
For the warm-up in this cool climate lesson, you will need to click on "Mapping" and then "US Mapping" once you arrive at NOAA's "US Climate at a Glance" page. Earth science explorers realize that 2012 was a warm winter for us. They read...
Curated OER
Using Vegetation, Precipitation, and Surface Temperature to Study Climate Zones
Using NASA's Live Access Server, earth scientists compare the temperature, precipitation, and normalized difference vegetation index for four different locations. They use the data to identify the climate zone of each location using...
Curated OER
Weather Data Analysis
In this weather worksheet, students read a data table comparing the temperature and weather conditions at three different locations. Students use this data to complete 8 fill in the blank, 1 short answer question, and one graph.
Montana State University
What's the Weather?
How many jackets do you need to stay warm and climb Mount Everest? An informatie resource covers the topic of Mount Everest, the resource helps young scientists discover the difference between climate and weather. Activities include...
Virginia Department of Education
Weather Patterns and Seasonal Changes
Get your class outside to observe their surroundings with a lesson highlighting weather patterns and seasonal changes. First, learners take a weather walk to survey how the weather affects animals, people, plants, and trees during...
Museum of Science
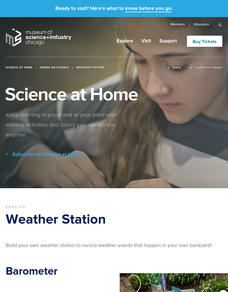
Weather Station
Find out what it is like outside before braving the elements. Teachers follow directions to build a barometer, rain gauge, and anemometer. Class members use the built weather instruments along with a thermometer to record weather...
Teach Engineering
Air Under Pressure
Introduce your class to air masses and how they affect the weather with a lesson that focuses on the differences between high and low air pressure systems. The class explores actual weather data using archived weather data.
Curated OER
Creating Climographs
Students use satellite data to compare precipitation and surface temperatures on different islands. In this satellite lesson students create graphs and explain the differences between weather and climate.
Curated OER
Graphing and Analyzing Biome Data
Students explore biome data. In this world geography and weather data analysis lesson, students record data about weather conditions in North Carolina, Las Vegas, and Brazil. Students convert Fahrenheit degrees to Celsius degrees and use...
NOAA
How Do We Know?: Make Additional Weather Sensors; Set Up a Home Weather Station
Viewers learn about three different weather measurement tools in installment five of the 10-part Discover Your Changing World series. They build weather vanes to collect data on wind speed, barometers to determine air pressure, and...
Curated OER
Weather Data - Percentages
In this weather worksheet, students calculate the percentage of weather conditions recorded over a month at three different locations. This worksheet has 12 problems to solve.


