US Environmental Protection Agency
Tree Rings: Living Records of Climate
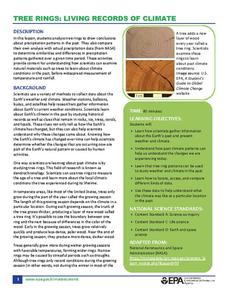
Open with a discussion on weather and climate and then explain how tree rings can provide scientists with information about the earth's past climate. Pupils analyze graphics of simulated tree rings from various US locations for the...
Curated OER
Graphing the Forecast - Line Graph or Bar Graph?
Sixth graders compare and contrast bar and line graphs. Using a weather forecast of the area, 6th graders record the high and low temperatures in a table. Students determine and justify the most appropriate graph to display a given set...
NOAA
El Niño
El Nino, La Nina ... and the Santa Maria? The 11th installment of a 23-part NOAA Enrichment in Marine sciences and Oceanography (NEMO) program explains the mechanism of El Nino/Southern Oscillation. Pupils use previous data to determine...
EngageNY
Relationships Between Two Numerical Variables
Is there another way to view whether the data is linear or not? Class members work alone and in pairs to create scatter plots in order to determine whether there is a linear pattern or not. The exit ticket provides a quick way to...
Curated OER
What Goes Up Must Come Down!!
Fifth graders look at actual sunrise and sunset times for their hometown to determine a pattern in the amount of daylight. They collect their data in Excel and create a chart to help them identify the pattern, then write an explanation...
Curated OER
Feeling the Heat
Pupils record temperatures at different locations around campus. They examine the results and draw conclusions about how materials and colors affect the amount of heat produced. They also analyze Los Angeles' temperature records over a...
PBS
Twirling in the Breeze
Blow classes away with a hands-on lesson investigating wind speed. Learners use common materials to design and construct anemometers. They then test their anemometers and collect data on the wind speed created by a fan.
Curated OER
History's Thermometers
Ancient coral beds give scientists clues to past ocean temperatures in much the same way that tree rings indicate historical weather conditions. High school scientists examine coral oxygen isotope ratios and plot the data as a function...
Laboratory for Atmospheric and Space Physics
Polar Vortex Interactive
An interactive lesson places pupils as scientists who must learn why the ozone layer is being destroyed by analyzing the data from multiple satellites. The first analysis shows how UV is related to the ozone cycle. The second...
Curated OER
Tracking Local Weather
In this activity, studens will use different types of weather gauges and track the local weather for a week. After the week is over, students will collect their samples, analyze the data, and compare their conclusions to local weather...
Curated OER
Tropical Atlantic Aerosols
Young scholars analyze NASA data from the Multi-angle Imaging Spectroradiometer. In this NASA data lesson, students access an assigned website to examine information from the MISR on the Terra Satellite. They determine how desert dust...
Curated OER
Weather
In this science worksheet, students find the words that are related to the weather and the answers are found when clicking the button at the bottom of the page.
Curated OER
Weather & Climate
In this science worksheet, students find the words that are related to weather and climate. The answers are found by clicking the button at the bottom of the page.
Curated OER
Weather Puzzle
In this science learning exercise, students find the words related to the concept of weather and the answers are found at the bottom of the page.
Curated OER
Weather Words
In this science activity, students find the words in the puzzle that correlate to the concept of weather and the answers are found at the bottom of the page.
Curated OER
Weather & other Natural Disasters
In this science worksheet, students find the vocabulary that links the concepts of weather and natural disasters. The answers are found by clicking the link at the bottom of the page.
Curated OER
Weather Maps
Students explain the collection of weather data as presented in different formats. They use appropriate terminology related to weather maps and use the Internet to capture weather data from a city of choice and present a TV style weather...
Curated OER
Going Local with Global Warming
Students examine climate change by using recent temperature records. In this data analysis lesson students plot weather data and study the differences between weather and climate.
Curated OER
Dripping Wet or Dry as a Bone?
Students use a sponge and water model to explore the concept of relative humidity and create a percent scale. They define humidity and saturation, build a simple humidity/saturation model, collect, predict and interpret data, and create...
Curated OER
Measuring Wind Speed
Young scholars study wind speed and collect wind speed data. In this wind speed lesson, students visit a website to learn about the local wind speed forecast for their week. Young scholars discuss wind and wind speed. Students collect...
Curated OER
Weather Watchers - Measuring Weather
Students explain ways that meteorologists measure and predict weather, collaborate on creating some weather measurement instruments and keep a weather journal for one week.
Curated OER
The Forecast Factory
Students role play weather forecasting activities. They investigate weather forecasting processes such as equations, data analysis, announcing by role playing in a large lecture hall.
Curated OER
Weather Word Search
In this science activity, students find the words related to the concept of weather and the answers are found by clicking the button at the bottom of the page.
Other popular searches
- Weather Data
- Recording Weather Data
- Collecting Weather Data
- Weather Atmospheric Data
- Graphing Weather Data
- Analyzing Weather Data
- Collect Weather Data
- Math Data Graph Weather
- Weather Data Projects
- Gathering Weather Data
- Weather Log Data Sheets


