Curated OER
Reading A Weather Map
Ninth graders construct a weather map. In this meteorology lesson, 9th graders construct a weather map using contour lines and temperature.
Curated OER
Weather
Pupils track wind speed and direction, barometric pressure, air temperature, and precipitation for a month using a newspaper. They chart the data over a months time.
Curated OER
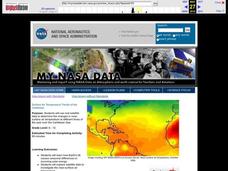
Surface Air Temperature Trends of the Caribbean
Students investigate the seasonal changes to sea surface and near-surface air temperatures near the equator. They use actual satellite data to track and graph the differences in air and sea temperatures during different seasons in the...
Curated OER
The Effect of Rain on Morning Temperatures
Eighth graders study the effects of the water cycle. They create a graph of the air temperature versus solar radiation on a rainy and clear 24 hour period using data from a provided link. Afterward, they answer questions to determine the...
Curated OER
THIS WEEK'S WEATHER
First graders create a picture graph representing their town's weather for one week.
NASA
Down to Earth
There are only 10 types of people in the world: those who understand binary and those who don't. The lesson includes four activities in which students learn binary, convert binary to images, understand CCD arrays, and interpret...
Curated OER
Measuring Snowfall
Students predict the amount of snowfall for the week and measure snowfall. In this measuring snowfall lesson, student use a precipitation gauge to measure the week's snowfall; and analyze the data to determine whether or not...
Curated OER
Weather Station
Students create their own barometer, precipitation, rain gauge, anemometer, and more with their weather stations. In this weather station lesson plan, students access on line websites on how to make their own weather tools.
Curated OER
Weather
In this science worksheet, middle schoolers find the words that are related to the concept of weather and the answers are found at the bottom of the page.
Curated OER
Circle the Earth - Explore Surface Types on a Journey around Earth
Students use CERES percent coverage surface data with a world map in locating landmasses and bodies of water at Earth's Equator.
Curated OER
Graph and Compare the Adventure's Temperature Vs. Local Temperature
Students explore the concept graphing data. In this graphing data lesson, students use weather data from their local weather and some other city and graph them. Students plot the local weather vs. another city. Students record...
Curated OER
Forecast Fever
Ninth graders investigate what high-tech tools are used to gather weather data and make weather forecasts. They view a video and a PowerPoint presentation, and conduct research on a cloud chart website. Students make local weather...
Curated OER
Surface Meteorological Observation System (SMOS)
Students monitor local surface weather conditions for at least 30 days. They interpret the data by graphing it and detemining percentages.
Curated OER
Weather Or Not
Young scholars use the internet to find pen pals to share in their weather experiment. Individually, they research the high and low temperatures for cities within the United States and email the results to their pen pal. They also...
Curated OER
Highs and Lows
Students use email to chart weather patterns and then graph their findings. In this weather patterns lesson, students chart their weather for a week at the school. Students then use email to find temperatures at a variety of locations....
Curated OER
Predicting Monthly Precipitation
Students should log onto, and collect data from, a specific site on the Internet. They average and compare the data using the Excel spreadsheet program, make predictions from their data, and determine the percent error of their predictions.
Curated OER
Weather Words
Third graders gather together as a class and share any facts or words about the science unit "Weather Elements". They listen to the story/poem, "Listen to the Rain" and recall any weather related words from the story.
Curated OER
How's the Weather
Students explore weather patterns. They collect and record all aspects of the weather from various sites. Students investigate regional weather and use a spreadsheet to record and chart data. Students chart temperature, humidity,...
Curated OER
Range, Mean, Median, and Mode
Eighth graders find the range, median, mean, and mode of a data set. In this finding the range, median, mean, and mode of a data set lesson, 8th graders collect data about the high and low temperature for 10 different cities. Students...
Curated OER
Global Warming Statistics
Students research real-time and historic temperature data of U.S. and world locations, and analyze the data using mean, median, and mode averages. They graph the data and draw conclusions by analyzing the data. A spreadsheet is used to...
Curated OER
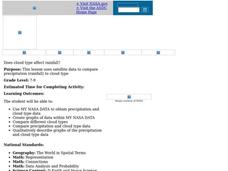
Does Cloud Type Affect Rainfall?
Student uses MY NASA DATA to obtain precipitation and cloud type data. They create graphs of data within MY NASA DATA. They compare different cloud types as well as precipitation types. They describe graphs of the precipitation and cloud...
Curated OER
Climate Change
Students compare weather data and draw conclusions. In this climate change lesson plan, students determine whether data collected over a period of ninety years shows a warming trend.
Curated OER
Bar Graphs
Young scholars perform operations and graph their data using charts and bar graphs. In this algebra lesson, students follow specific steps to make a bar graph. They create a survey about people favorite things and plot their data from...
Curated OER
Environment: Wild Wind Direction
Students examine the different types of wind patterns. Using common materials, they construct weather vanes to measure and record wind direction over a two-week period. After analyzing the data, they draw conclusions about the...
Other popular searches
- Weather Data
- Recording Weather Data
- Collecting Weather Data
- Weather Atmospheric Data
- Graphing Weather Data
- Analyzing Weather Data
- Collect Weather Data
- Math Data Graph Weather
- Weather Data Projects
- Gathering Weather Data
- Weather Log Data Sheets


