National Wildlife Federation
What is DBH?
When measuring the circumference of a tree, does it matter how high you place the measuring tape? Most scholars have never considered this question, but scientists know that measurement techniques must be standardized. The 13th...
Curated OER
Clear Day, Cloudy Day; Weather, Cloud Types and Formations
Students explore the formation of clouds and different cloud types. Students simulate a cloud formation within a bottle.
NOAA
Earth Origami
After reading a brief history of Carl Skalak's journey on the open waters, scholars make a three-dimensional model of the Earth out of an Origami balloon using a printable decorated as the Earth.
Curated OER
The Hat
Honing reading and communication skills through the theme of farm animals is the focus of this lesson. Students read a book about Scandinavian farm animals and complete prediction journal activities. They complete a worksheet about the...
Curated OER
Becoming a Meteorologist
Students identify the job of a meteorologist. In this meteorologist lesson plan, students read Cloudy with a Chance of Meatballs and view clips of weather forecasts. Students visit the Weather Channel website and sing a weather song....
Curated OER
Hurricanes
Eighth graders gather information on hurricanes that are affecting the world at the time of the lesson. They work together in groups to collect the data and record their information in a table. They are asked questions to finish the lesson.
Curated OER
Weather Conditions During The Fall Monarch Migration
High schoolers keep detailed weather records during the fall migration. If they are also Observing Fall Migrants, they will be able to compare weather conditions on days that they do and do not see monarchs. Having a class record of...
American Physiological Society
Did I Observe it or Infer it?
Take the mystery out of inquiry! When young scientists learn to use their keen powers of observation to make smart inferences about a situation, they are well on their way to understanding what the scientific method is all about. Using...
Curated OER
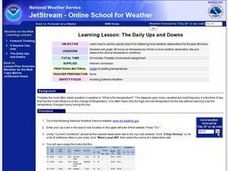
Learning Lesson: Ups and Downs
Students use the internet to find the air temperatures in their area. They create a graph based on the data. They analyze the data and examine tips for avoiding extreme weather.
Curated OER
Design Weather Instruments using LEGO Sensors
Students design and create a LEGO structure that will house and protect a temperature sensor. They leave the structure in a safe spot and check the temperature regularly and chart it. After the students have built their structures, the...
Curated OER
Historical Temperatures
Students research historical regional temperatures for their current season. In this historical weather instructional activity, students conduct weather station and Internet research to learn about historical regional temperatures....
Curated OER
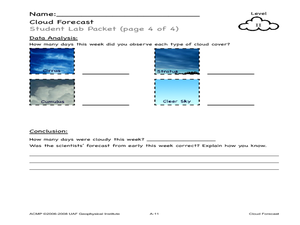
Cloud Forecast
Students record weather observations and research online weather data. In this weather observations lesson, students study the cloud cover for several days and record their observations in a chart. Students identify the cloud types and...
Curated OER
What Should I Wear Today?
Fourth graders examine weather data for Columbus, Ohio using an Internet resource. They complete a two day and a weekly weather charts before discussing the information. After the discussion, they answer questions about the charts...
Curated OER
Dimming the Sun
Students collect, interpret and analyze weather variable data. They describe atmospheric variables that affect evaporation. Students create graphs and analyze the information collected.
Curated OER
Plot! Analyze! Draw your Conclusions!
Students download data reported from the Global Sun Temperature Project website. They graph and analyze the data looking for trends and patterns. They prepare a class report with their observations and post it to the website.
Curated OER
Transport
Students analyze wind barbs and determine which way the wind is blowing and how hard the wind is blowing. They access near real time wind data and pollutant animations to track the transport and destination of pollutants.
Curated OER
Class Final Report - Global Sun Temperature Project
Students reflect on the data they have analyzed during the Global Sun Temperature Project. They use the project website as a resource for their observations, draft a class report and post it on the Internet.
Curated OER
Drought in Your State
In this drought activity, learners study the "US Drought Monitor" and complete 8 short answer questions on the causes and effects of drought.
Curated OER
Comparing Temperature, Pressure, and Humidity
Students investigate data on temperature, pressure, and humidity by downloading information from the ARM Website. Working in groups, they discover how weather impacts life in each of the ARM sites. They record weather data in their...
Curated OER
Investigating Median, Mode, and Mean
Students develop strategies to organize data while following teacher demonstration. They calculate the mean, median and mode of a data set while determining the relationships between the numbers. They analyze data from tables and double...
Curated OER
Trends of Snow Cover and Temperature in Alaska
Students compare NASA satellite data observations with student surface measurements of snow cover and temperature. They practice data collection, data correlations, and making scientific predictions.
Curated OER
Probability With a Random Drawing
Young scholars define probability, and predict, record, and discuss outcomes from a random drawing, then identify most likely and least likely outcomes. They conduct a random drawing, record the data on a data chart, analyze the data,...
Curated OER
Hot, Wet, and Cold
Pupils research climate data for a city in each of the 5 major geographic sections of Texas. They use data to describe the climate and what influence the geography of that section has on the weather.
Curated OER
Climate Patterns across the United States
High schoolers articulate differences between climate and weather using examples in a written statement. Using climate data from across the country, they describe climate patterns for various parts of the United States on a map. Students...
Other popular searches
- Weather Data
- Recording Weather Data
- Collecting Weather Data
- Weather Atmospheric Data
- Graphing Weather Data
- Analyzing Weather Data
- Collect Weather Data
- Math Data Graph Weather
- Weather Data Projects
- Gathering Weather Data
- Weather Log Data Sheets


