National Wildlife Federation
Wherefore Art Thou, Albedo?
In the sixth instructional activity in a series of 21, scholars use NASA data to graph and interpret albedo seasonally and over the course of multiple years. This allows learners to compare albedo trends to changes in sea ice with...
Curated OER
Weather Data Analysis
In this weather worksheet, students read a data table comparing the temperature and weather conditions at three different locations. Students use this data to complete 8 fill in the blank, 1 short answer question, and one graph.
Curated OER
Weather, Data, Graphs and Maps
Students collect data on the weather, graph and analyze it. In this algebra instructional activity, students interpret maps and are able to better plan their days based on the weather reading. They make predictions based on the type of...
Radford University
A Change in the Weather
Explore the power of mathematics through this two-week statistics unit. Pupils learn about several climate-related issues and complete surveys that communicate their perceptions. They graph both univariate and bivariate data and use...
Curated OER
Current Weather
A great year around activity that shows young mathematicians how the math skills they are learning are actually used in the real world. This exercise also helps learners begin to distinguish the difference between weather and climate. As...
Curated OER
How Does the Earth's Energy Budget Relate to Polar Ice?
Students use satellite data to see how radiation budget relates to the ice that is present in the North. In this energy lesson students correlate data to see a relationship.
Space Awareness
The Climate in Numbers and Graphs
Weather versus climate: weather relates to short time periods while climate averages the weather of a period of many years. Scholars learn about average temperature and precipitation in various climate zones and then apply statistics...
NASA
The Types of Clouds and What They Mean
Learn to forecast the weather using cloud types. Budding meteorologists identify cloud types and learn to use a dichotomous key. As scholars develop observation and identification skills, they discover how different cloud types cause...
Smithsonian Institution
Weather Widget
What's so difficult about predicting the weather? Scholars work collaboratively to build a device that models how meteorologists use computers to forecast weather. Team members collect and interpret data while working together to...
Curated OER
How Does Your Garden Grow? Discovering How Weather Patterns Affect Natural Cycles
For the warm-up in this cool climate lesson, you will need to click on "Mapping" and then "US Mapping" once you arrive at NOAA's "US Climate at a Glance" page. Earth science explorers realize that 2012 was a warm winter for us. They read...
K20 LEARN
The Parched Plains: Weather And Climate
How do meteorologists differentiate between droughts and dry spells? Introduce the concepts of weather forecasting and prediction with an insightful research-based lesson plan from the K20 series. Partners synthesize individual research...
Curated OER
Adopt a City-Winter Weather
In weather worksheet, students use an on line site to collect weather data. They create 10 different weather scenarios using a temperature and humidity slider. They includethe temperature, relative humidity and weather conditions and...
Curated OER
2nd Grade - Act. 28: Calendar & Weather Book
Second graders will track the weather patterns throughout the school year. This project spans the school year and takes five minutes per day or less. Measuring, data collection, and predictions are all explored throughout this relevant...
Laboratory for Atmospheric and Space Physics
Science at 100,000 Feet
Take your class up, up, and away with an engaging weather balloon simulation! Individuals get hands-on experience in creating and launching their own airborne labs to study how temperature and pressure affect substances at 100,000...
Curated OER
1492: Using Data to Explain a Journey
Students examine how Christopher Columbus made his way across the Atlantic. In this data lesson students use an Internet program to navigate like Columbus.
Curated OER
Weathering Lab
Assist your middle school class with one of the most inclusive weathering and erosion labs available. Individuals use sugar cubes and alka-seltzer to demonstrate the process of physical and chemical weathering. They sketch results...
Curated OER
Weather or Not!
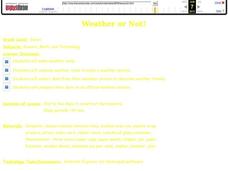
Seventh graders discuss weather. In this meteorology lesson, 7th graders view a movie on weather and take a quiz. They work in groups to make weather tools for a class weather station.
Chicago Botanic Garden
Are Global CO2 Levels Changing?
According to the Mauna Loa observatory, carbon dioxide levels increased by 3 ppm in our atmosphere between 2015–2016. Individuals analyze carbon dioxide data from around the world and then share this with a home group in...
Towson University
Looking Backwards, Looking Forward
How do scientists know what Earth's climate was like millions of years ago? Young environmental scholars discover how researchers used proxy data to determine the conditions present before written record. Grouped pupils gain experience...
Chicago Botanic Garden
Climate Change Around the World
You know climate change is happening when you see a bee take off its yellow jacket. Part four in a series of five lessons explores all factors affecting climate change: temperature, cloud cover, precipitation, and carbon dioxide. By...
Curated OER
Weather and Climate
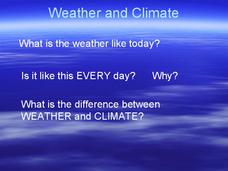
It's hot today, but is that the weather or the climate? This colorful presentation isolates both concepts to allow for better understanding by covering the positioning of the planet, making comparisons of land versus water, and looking...
NOAA
Understanding El Niño Using Data in the Classroom
Are weather troubles caused by El Nino? An installment of a larger series presents a five-part lesson on El Nino. First, scholars learn to read sea surface temperature maps. Then, they compare them to data on graphs before determining if...
Curated OER
Weather Lesson
Middle schoolers discuss the weather conditions. They read thermometer, rain gauge, barometer, and wind direction and speed. They record observations of weather conditions and enter information into data base on the computer.
National Wildlife Federation
Conceptualizing Module II - Putting It All Together
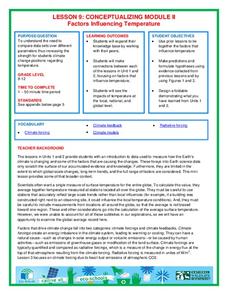
"Creativity is just connecting things." - Steve Jobs. After weeks of researching climate change, the ninth lesson in a series of 21 combines the data and analysis to address essential questions. It covers natural phenomenon, human...
Other popular searches
- Weather Data
- Recording Weather Data
- Collecting Weather Data
- Weather Atmospheric Data
- Graphing Weather Data
- Analyzing Weather Data
- Collect Weather Data
- Math Data Graph Weather
- Weather Data Projects
- Gathering Weather Data
- Weather Log Data Sheets


