Curated OER
What's Going to Happen at Any Given Barometer Reading?
Fourth graders brainstorm a list of words associated with weather. In groups, they sort the words into categories and observe the weather in their area for a month. To end the lesson, they compare the barometer measurements for a...
Curated OER
Meterology -- Atmosphere
Fourth graders discover how weather predictions are made. They list the responsibilities of a meteorologist. They identify weather instruments and state their functions.
Curated OER
Meteorology -- Clouds
Fourth graders examine the processes of condensation and evaporation. They identify the three types of clouds and state the weather that is possible with each type of cloud. They ask questions to end the lesson.
Curated OER
Outdoor Observation
Pupils examine their outside environment. They use their senses to make observations of the four seasons. They keep a chart of all of the data they have collected.
Curated OER
Agriculture
Students examine the types of agriculture in their own state and in their local community. They examine how food makes it to their local grocery store. They compare data from different states.
Curated OER
How Soft or Hard is Your Water?
Students test samples of water to determine how a chemical water softener affects water's ability to form suds. After collecting their data and analyzing their results, students answer follow-up questions about their lab.
Curated OER
An Introduction to Jan Brett
Students explore the concept of Jan Brett. In this author study lesson, students are introduced to several Jan Brett books with visuals, listening centers, and video. Students browse the internet in search of information...
Curated OER
Radiation Comparison Before and After 9-11
Using the NASA website, class members try to determine if changes could be detected in cloud cover, temperature, and/or radiation measurements due to the lack of contrails that resulted from the halt in air traffic after the attacks...
Space Awareness
Continental Climate and Oceanic Climate
There's nothing better than a cool breeze blowing in from the ocean. Scholars explore how water affects change in temperature using a hands-on experiment on climate. They use measurement tools to compare the continental and oceanic...
Wind Wise Education
What Causes Wind?
Through watching several classic air pressure demonstrations, middle schoolers determine that high pressure areas move toward lower pressure areas, heated air causes a drop in pressure, and forces exist when pressures are unequal....
Curated OER
The Mitten
Explore the Ukraine through a reading of The Mitten. Readers will determine the sequence of events, cause and effect, make predictions, and find the main idea of the story. They also use math skills to make charts and graphs. Finally,...
Curated OER
"Across Oregon On The 45th N Parallel" A Transect of Oregon
Students explore the physical geography of Oregon. In groups, students collect weather and elevation information on Oregon. They organize the data and create maps and graphs of the information. Afterward, students compare the...
Curated OER
Geography Search: The New World
Students explore the "New World". They collect geographic information related to the ocean, latitude and stars, longitude and time, wind patterns, and the weather. They analyze the geographic data and make decisions to plot their...
Curated OER
Environment: Climate Change
Students explore climate change and the greenhouse effect. Using provided definitions, they assess local weather conditions and analyze long term climatic data for their areas. Once they explore the concept of and connection between...
Curated OER
Tracking a Hurricane
Students play the role of amateur meteorologists and track a hurricane. In this hurricane instructional activity, learners follow a hurricane by tracking its coordinates on an overhead map. Students work in small groups to place dots on...
Curated OER
Is Global Warming Affecting Hurricanes?
In this hurricane worksheet, students use data charts showing the number of hurricanes and the severity of these hurricanes to determine if global warming is causing an increase in hurricanes. This worksheet has 2 short answer questions.
Curated OER
Wind Energy
Students explore wind energy by making a pinwheel to model a wind turbine. They experiment with their turbine by placing it in different locations for optimal energy.
Curated OER
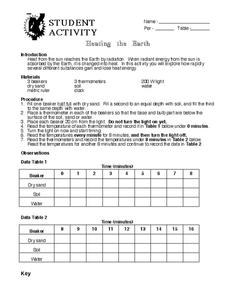
Heating The Atmosphere
In this science worksheet, high schoolers look for the answers to finding the correct temperatures that match the location in the atmosphere.
Curated OER
Hurricane Season
In this science worksheet, students find the vocabulary terms related to the subject of hurricanes. The answers are found by clicking the button found at the bottom of the page.
Curated OER
Hurricanes Word Search
In this science worksheet, students find the vocabulary terms related to the subject of hurricanes. The answers are found by clicking the button at the bottom of the page.
Curated OER
Hurricane Katrina
In this science learning exercise, students find the words while learning the vocabulary of Hurricane Katrina. The answers are found at the bottom of the page.
Curated OER
Dateline: El Niño
Students explore El Nino and take the role of a reporter gathering the facts for a news story. Reports are presented orally, like a newscast, written or in whatever form the teacher prefers.
Curated OER
What Causes Irregular Temperature Patterns?
Students examine common trends in climate across the U.S. They identify the anomalies in hot-cold temperature differences in the U.S and locate them on the map using latitude and longitude coordinates.
Curated OER
Hectic Hurricanes!
Students determine what they know about hurricane formation. They experiment to explain hurricane formation and track a hurricane that forms in the Caribbean Islands.
Other popular searches
- Weather Data
- Recording Weather Data
- Collecting Weather Data
- Weather Atmospheric Data
- Graphing Weather Data
- Analyzing Weather Data
- Collect Weather Data
- Math Data Graph Weather
- Weather Data Projects
- Gathering Weather Data
- Weather Log Data Sheets


