Curated OER
Monarch Butterfly Migration Map
Students examine the migration patterns of the monarch butterfly. They practice using color-coded maps. They create their own maps based on the butterfly's migration. They share their maps wtih the class.
Curated OER
Beautiful Bovine
Students compare and contrast a human body to a cow. Using a diagram, they label and identify the functions of the cow's numerous parts. In groups, they create a Venn Diagram to compare the various types of cows with one another. They...
Curated OER
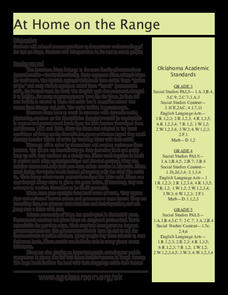
At Home On The Range
Learners explore the history and domestication of the Bovidae family and their importance to our prairie ecosystem. Using a map of the United States, students located the American Great Plains. They complete worksheets and discuss...
Curated OER
Express Yourself
Sixth graders write to Key pals. In this description lesson, 6th graders describe a place to their key pals and the pal has to draw a pictures based off their description. They also create a Fun Facts Worksheet about their...
Curated OER
Time and Cycles - Dendrochronology
Middle schoolers investigate the lives of trees by examining ring cycles. In this plant life instructional activity, students identify the field of study known as dendrochronology and discover its history. Middle schoolers...
Curated OER
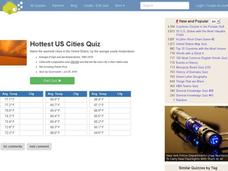
Hottest US Cities Quiz
In this online interactive geography quiz worksheet, students respond to 20 identification questions about the hottest cities in the United States. Students have 4 minutes to finish the timed quiz.
Curated OER
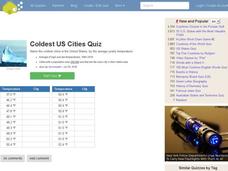
Coldest US Cities Quiz
In this online interactive geography quiz worksheet, students respond to 20 identification questions about the coldest cities in the United States. Students have 4 minutes to complete the quiz.
Curated OER
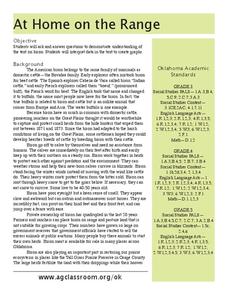
At Home on the Range
Students discuss the American bison. In this social studies lesson, students discuss the history of the American bison and graph the decline of the bison population.
Curated OER
Seasons
First graders create a KWL chart about the four seasons. In this four seasons lesson plan, 1st graders continue the chart by watching videos and drawings.
Curated OER
Using Soil properties and Vegetation Differences to Hypothesize the Land Use History and Topographic Differences between Two Locations
Ninth graders take soil samples and perform tests on these samples.
Curated OER
Understanding Cloud Formation
Students explore air and clouds by watching demonstration. They perform an experiment to measure air pressure changes.
Curated OER
Introduction to Drawing Isopleths
Students draw isopleths based on how many pieces of "confetti snow" land in their cup.
Curated OER
Science: Hurricanes As Heat Engines
Pupils conduct Internet research to track the path of Hurricane Rita. They record the sea surface temperature of the Gulf of Mexico during and after the hurricane and draw conclusions about how hurricanes extract heat energy from the...
Curated OER
Science: Trouble in the Troposphere
Learners research a NASA Website and record information about an assigned city's tropospheric ozone residual monthly climate. In groups, they graph the information for the past year. They form new groups and compare their city's...
Curated OER
Averages: Computing Mean, Mode and Median
Seventh graders use daily temperature models to find the mean, mode and median.
Curated OER
Create Your Own Investigation
Students design and implement an experiment intended to measure and analyze the air quality of a particular location. They focus on looking for ozone and particulate pollutants.
Curated OER
Stratigraphy -- Layers of Time in the Earth
Students are introduced to the process of stratification. Using the internet, they read about the Richard Beene archeological site near San Antonio. Using a map, they color code the different layers present at this site and answer...
Curated OER
Exploring Climate Change with GIS
Students investigate climatological changes that are occurring to the Earth. In this climate change lesson, students access an assigned web site to view maps and lessons that show how climate change makes a difference to life on Earth.
Curated OER
Wind
Fourth graders are read a story and answer the comprehension questions about sound and wind. In groups, they make their own wind vane and how to determine the direction of the wind. To end the lesson, they make their own Anemometer to...
Curated OER
How Much Is There To Eat?
Tenth graders compare the relationship of food production and population in India with the southern regions of the United States.
Curated OER
Why Here? Why Not There?
Middle schoolers analyze a map and graph information on eleven countries. Using the characteristics of the countries, they determine if they should host the summer or winter Olympic games. After viewing a video, they locate the...
Curated OER
Introduction to WorldWatcher: Coloring Temperature Maps
Students are introduced to the software program WorldWatcher. In groups, they discover the temperature variations throughout the world and color a map according to the temperatures. They also practice using visualization to communicate...
Curated OER
Effects of Ozone in the Air
Fifth graders learn how ground-level ozone is an air pollution problem. Students measure ozone levels and graph the results.
Curated OER
Bar Me In
Fourth graders watch a video about constructing bar graphs. They create their own graph and interpret it.
Other popular searches
- Weather Data
- Recording Weather Data
- Collecting Weather Data
- Weather Atmospheric Data
- Graphing Weather Data
- Analyzing Weather Data
- Collect Weather Data
- Math Data Graph Weather
- Weather Data Projects
- Gathering Weather Data
- Weather Log Data Sheets


