Curated OER
Mean, Median and Mode
Fourth graders describe weather data using the mean, median and mode. In this mean, median and mode lesson, 4th graders understand how to calculate data using mean, median and mode and why they would use each one.
Curated OER
Climate Systems - Which Location Is Best For Me?
Students study the difference between weather and climate. In this climate systems lesson students search the Internet for the parts of the Earth's system, gather climate data and complete a challenge scenario.
Curated OER
Temperature Bar Graph
Students explore mean, median and mode. In this math lesson, students analyze temperature data and figure the mean, median, and mode of the data. Students graph the data in a bar graph.
Curated OER
Jumping to Conclusions
Students decide as a class what their data is going to be to graph. In this math lesson, students organize data so that it will be easier to display in a graph. Students are guided through the process by their teachers, and helped with...
Curated OER
Canada's Climate: Temperature and Rainfall Variations
Students analyze data about various climates in Canada. In this data analysis and climate lesson, students use Canada Year Book 1999 to complete a worksheet and make connections between precipitation and temperature in different climates.
Curated OER
Hurricanes and Climate
Students investigate maps and data to learn about the connections between hurricanes and climate. In this exploratory lesson students describe and graph the 6 regions where hurricanes happen and discuss how hurricanes have changed over...
Curated OER
Bluebirds Project
In this bluebirds project worksheet, students are given directions on completing a project about bluebirds including measurements, scientific method questions, data entry, and more. Students complete 15 exercises.
Curated OER
Probability
Third graders conduct experiment, collect data, predict, record, and discuss outcomes, and analyze data for probability.
Curated OER
Ready, Set, Drift!
Students define data, recover data from the Internet, and use information they obtain to solve problems. In this investigative instructional activity students answer questions on a worksheet and demonstrate the use of a maneuvering...
Curated OER
Graphing Climate Information
Seventh graders plot the data for the average monthly precipitation for three cities. They make a graph using a spreadsheet.
Curated OER
Probing Under the Surface
Eighth graders use a measuring stick to determine the shape of the inside of the bottom of a box, then apply their knowledge to an additional situation. This task assesses students' abilities to make simple observations, collect and...
Curated OER
Formation of Rain
Students sequence the steps leading to the formation of rain, and design a model to represent these steps. This task assesses students' abilities to classify, generalize, infer, interpret and communicate data, and construct a pictorial...
Curated OER
Formation of Wind
Young scholars correctly sequence the steps leading to the formation of wind, and describe the cause and effect relationships involved in the formation of wind. This task assesses students' abilities to classify, generalize, infer,...
Curated OER
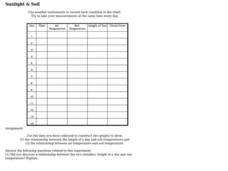
Sunlight & Soil
In this earth science worksheet on sunlight and soil, learners use data collected in a chart to construct two graphs. Following, they answer five questions as they relate to the experiment performed.
Curated OER
Weathering and Wind
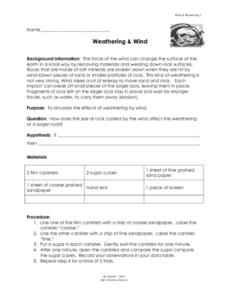
In this weathering and wind worksheet, students simulate the effects of weathering by wind using 2 canisters, 2 types of sandpaper and 2 sugar cubes. Students swirl the sugar cubes inside the canisters lined with fine and course...
Curated OER
Rocks and weathered rocks
Students connect rock and mineral formation with the changes rocks and minerals undergo at the earth's surface. They observe changes produced by weathering and relating these observations to chemical processes such as oxidation,...
Curated OER
Weather Observation Journal
Students record weather for a period of one month. In this weather lesson, students observe weather for one month on a large pictograph. Students record clouds, wind, temperature and any other weather conditions they observe. Students...
Curated OER
Elders' Weather Forecasting
Students interview an Elder to determine ways of forecasting the weather. For this weather lesson, students use the information from an interview to make a weather prediction.
Curated OER
Weather temperatures
Students investigate the given statistics about temperatures in cities around the nation in order to look for a pattern. They measure the mean, median, and mode for the data set of temperatures.
Curated OER
Activities to Enhance STEDII Data
Students develop an understanding of related weather processes such as wind, cloud cover, and temperature using STEDII data and instrumentation. In addition, they integrate mathematical calculations to produce a forecast map.
Curated OER
Weather Watchers
Students are introduced to an Underground Weather Stations. In groups, they use the internet to research the weather in different parts of the United States locating each city. To end the lesson, they summarize the information they...
Curated OER
Making Weather-Tracking Tools
Young scholars build tools to help track the weather. In this weather lesson plan, students follow directions to build a rain gauge, barometer and hair hygrometer.
Illustrative Mathematics
How is the Weather?
This activity asks learners to interpret data displayed on a graph within the context of the problem. Students are given three graphs that show solar radiation, or intensity of the sun, as a function of time. They are also given three...
Curated OER
Weather Report Chart
Young scholars complete a weather report chart after studying weather patterns for a period of time. In this weather report lesson plan, students measure temperature, precipitation, cloud cover, wind speed, and wind direction for a...
Other popular searches
- Weather Data
- Recording Weather Data
- Collecting Weather Data
- Weather Atmospheric Data
- Graphing Weather Data
- Analyzing Weather Data
- Collect Weather Data
- Math Data Graph Weather
- Weather Data Projects
- Gathering Weather Data
- Weather Log Data Sheets


