Curated OER
Data Sampling
Students discover data sampling. In this science lesson plan, students explore data sampling and turn the data collected into useful information by making graphs and using them to solve problems.
Curated OER
First Grade Shoe Sizes
Third graders collect shoe size data from classmates in their room and another third grade. They predict what the most common shoe size will be. They place the data in an spreadsheet on the computer. They design a graph using the...
Curated OER
Graphing the Forecast-Line Graph or Bar Graph?
Students explore bar and line graphs. In this data collection, graphing, and weather lesson plan, students compare bar and line graphs and discuss which type of graph would be most appropriate for displaying a ten day weather forecast....
Curated OER
All About Graphs
Learners practice organizing data by creating graphs. In this statistics lesson, students survey the class about favorite colors and create a bar graph using the data. Learners complete a test based on pet and animal statistics.
Curated OER
Where's The Beef
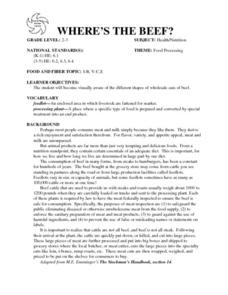
Students create and conduct a survey in the community to evaluate the demographics of vegetarians in the community. They compile data, create graphs, calculate percentages, and draw conclusions about the survey data. Students create an...
Curated OER
Favorite Days
Students collect and organize data about themselves. In this data analysis lesson, students discuss their favorite calendar dates and explore ways to display the data.
Curated OER
Venn Diagrams
Young scholars collect and display data in a Venn Diagram. In this statistics lesson, students collect data, compare the data and make inferences about their data. They use the Venn diagrams to identify what the data have in common and...
Curated OER
Survey Says...
Young statisticians collect, organize, and present data to illustrate responses to a survey question. They write and conduct the survey. They finish by presenting the results in the form of a graph.
Curated OER
Who's Range is it?
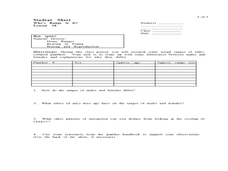
Students investigate the habits of panthers by analyzing radio transmitted data. In this animal life lesson, students utilize computers to view the range of different statistics dealing with Florida panthers. Students complete a...
Curated OER
Fun With Rainfall Measurements
Demonstrate how rain is measured. Pupils will use a rain gauge to measure the amount of rainfall during one week. Then record the data and discuss the results.
Curated OER
Cruel Schools
Students survey the climate of their school. In this personal health lesson, students discuss bullying and violence in schools. Students then complete a school climate survey, compile the results, and interpret them. Students write data...
Curated OER
2010 Census Lesson 1: It's About Us
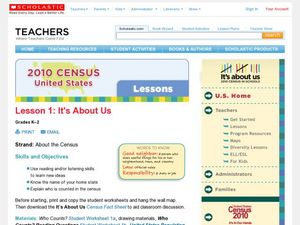
Students analyze data from the 2000 census to learn how the census works. In this civics lesson, students read a story to find out about the census, then use a map and census data to analyze changes. Lesson includes related resources...
Curated OER
Calculating Baseball Statistics
Students calculate baseball statistics. In this data analysis instructional activity, students use baseball statistics to calculate the batting average and slugging percentage. Students visit www.funbrain.com to play a math baseball game.
Curated OER
Galluping Away
Pupils use Gallop Poll results to explore causes and effects of the concerns of Americans in the past. They administer a similar poll and consider what Americans in their community view as the most pressing problems in the United States...
Curated OER
Kindergarten Class Favorites
Students discuss their favorite foods, a list of four favorite food are compiled on the board or a chart. They each vote for their favorite food and the data is entered onto a spread sheet and a graph is created while the students watch...
Florida International University
Counting FishStix
How do we count the fish in the ocean? An engaging instructional activity models how to estimate fish populations with observational surveys. Class members begin by studying the behavior of fish on the coral reef in the oceans. They...
Curated OER
Using Random Sampling to Draw Inferences
Emerging statisticians develop the ability to make inferences from sample data while also working on proportional relationships in general. Here, young learners examine samples for bias, and then use random samples to make inferences...
Virginia Department of Education
Weather Patterns and Seasonal Changes
Get your class outside to observe their surroundings with a lesson plan highlighting weather patterns and seasonal changes. First, learners take a weather walk to survey how the weather affects animals, people, plants, and trees during...
Curated OER
Dealing with Data
Seventh graders collect and analyze data. In the seventh grade data analysis lesson plan, 7th graders explore and/or create frequency tables, multiple bar graphs, circle graphs, pictographs, histograms, line plots, stem and leaf plots,...
Curated OER
Dynamic Data Range, Mode, Median, and Mean
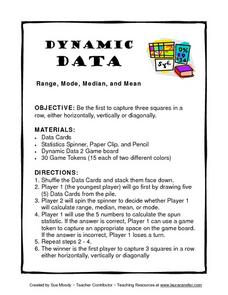
In this lesson plan, Dynamic Data Range, Mode, Median, and Mean, students play a game while figuring range, mode, median, and mean. Students spin for their task, figure the mode, mean, median or range of a row of numbers and gain a space...
Curated OER
Handling Data: measure of Average
Fifth graders analyze data from a simple table. In this graphing instructional activity, 5th graders compare distributions. Students recognize that the mean helps them find the formula. Students answer questions on the mean, median,...
Curated OER
Interpreting Data and Statistics
Students define terms and analyze data. In this statistics lesson plan, students plot their data using bar and line graphs. They analyze their data after they graph it and apply the results to the Great Depression.
Mabry MS Blog
Scatter Plots
Scatter plots are a fun way to gather and collect relevant data. The presentation goes through several examples and then describes the different types of correlation.
Curated OER
Looking at Data
Third graders use two days to create, collect, display and analyze data. Classroom activities and practice build greater understanding to a variety of forms used to display data.


