Open Oregon Educational Resources
Forest Measurements: An Applied Approach
Geometry—it's not just for the math classroom! Learners explore the field of forestry through a mathematical lens. An instructional resource explains how forest workers collect data about trees such as height, diameter, and age using...
Curated OER
Weather instruments
Students explore weather instruments. In this weather lesson, students make rain gauges, anemometers, and barometers following the instructions given in the lesson. Students set up a weather station using their instruments and record and...
American Statistical Association
Speedster
Catch me if you can. Scholars collect data on reaction time by catching a falling ruler or by using an Internet app. They determine the median of the data, create graphs, and analyze the results. They also compare their data to the rest...
EngageNY
Margin of Error When Estimating a Population Proportion (part 1)
Use the power of mathematics to find the number of red chips in a bag — it's a little like magic! The activity asks learners to collect data to determine the percentage of red chips in a bag. They calculate the margin of error and...
University of Georgia
Splat!
What does viscosity have to do with splatter? An activity shows that the viscosity of a substance is inversely proportional to the distance of its splatter. Learners conduct the experiment by collecting data, graphing, and analyzing the...
Discovery Education
How's the Weather?
Young meteorologists explore different aspects of the weather while learning about measurement devices. They build instruments and then set up a weather station outside and measure temperature, humidity, air pressure, wind speed, and...
Florida Department of Health
Understanding the Risk of Substance Abuse Unit
Teenage brains are different! Understanding that the teenage brain is still developing and thus more impacted by substance abuse is the key concept in a three-lesson high school health unit. Participants learn about how the brain and...
Balanced Assessment
Fit-Ness
Serve four towns with one bus route. Pupils develop a bus route that meets certain criteria to serve four towns. They determine which of the routes would best serve all of them. Individuals then hypothesize where a fifth town should be...
Las Cumbres Observatory
Astronomical Seeing - How Good Are the Observing Conditions?
Why is star gazing easy on some nights and difficult on others? Pupils aim to quantify the answer in an enlightening astronomy lesson. After collecting images from an online robotic telescope, they measure the brightness of images using...
Curated OER
From Curiosity Cabinet to Museum Collection
Learners study binomial nomenclature and museum-based research. They create a curiosity box, label the objects in their curiosity box , develop a classification scheme for the objects, and create a database of all objects collected by...
American Statistical Association
The Taste of Yellow
Does lemonade taste better when yellow? A tasty experiment has scholars determine the answer to the question. It requires conducting a taste test with lemonades of different colors (from food coloring), and then collecting and analyzing...
Teach Engineering
Density Column Lab - Part 1
Mass and density — aren't they the same thing? This activity has groups use balance beams and water displacement to measure several objects. The pupils use the measurements to calculate the density of the objects.
University of Connecticut
Building Your Own Biosphere
On September 26, 1991, four women and four men entered the scientific experiment, Biosphere 2; the doors were sealed for two years in order to study the interactions of a biosphere. In the activity, scholars explore biospheres by...
American Statistical Association
Spinners at the School Carnival (Equal Sections)
Spin to win a toy car. A fun activity has pupils use a spinner in which three of the equal sections represent winning a toy car, and the fourth section represents no car. They record the number of wins after certain numbers of spins,...
Lesson Plans
Student Info
Inform your instruction with information about your pupils. These student information pages will help you gather data about your classes. The first page focuses on educational history and preferences and the second asks for contact...
EngageNY
Grade 9 ELA Module 2, Unit 2, Lesson 15
The terrible truth begins in a instructional activity that focuses on the final act of Sophocles' Oedipus the King. As ninth graders collect evidence that details the origin of Oedipus and how his birth relates to the prophecy everyone...
Curated OER
Walking on Air
Pupils collect and analyze data with a graph. In this statistics instructional activity, students use central tendencies to find the meaning of their data. They display the data on a Ti calculator.
Curated OER
How High Are the Clouds?
Learners analyze height and collect data to create a graph. In this statistics lesson, students use central tendencies to analyze their data and make predictions. They apply concept of statistics to other areas of academics to make a...
Curated OER
Can You Make a Hole in One?
Students relate miniature golf to reflection of an image. In this algebra lesson, students collect and graph data as they study linear equations. They apply properties of graphing to solve real life scenarios.
Curated OER
Robot Rounding!
Students collect data on a robot and relate the behavior to prove there is an infinite minute set of numbers. In this algebra lesson, students verify that there is always a number between two numbers. They analyze and make inference from...
Curated OER
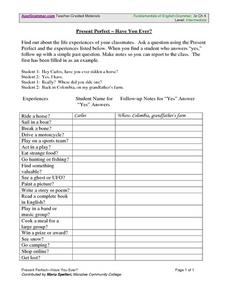
Present Perfect Verb Tense- Class Data Collection Activity
In this verb tense and data collection worksheet, students find out about the life experiences of their classmates. They ask questions using the present perfect tense and the suggestions in a chart on the page. They record the...
Curated OER
Patterns Here, There and Everywhere
Pattern recognition is a skill often used in mathematics. Learners count and sort manipulatives, organize the data into a graph and answer questions about the information displayed. They collect the objects to be used and create patterns...
Curated OER
FILLING IN THE GAPS - Acquiring and Analyzing Satellite and Ground-Based Data
Students monitor rainfall, compute daily averages, and compare their methods of computation to those used by actual researchers using satellite observations.
Curated OER
Graph Frenzy!!
Learners brainstorm for a survey question to ask classmates. They survey their classmates. They enter the results into a spreadsheet and create the best graph for the information. They share their graphs with the class.
Other popular searches
- Collecting and Recording Data
- Collecting and Organizing Data
- Collecting and Graphing Data
- Collecting and Using Data
- Games on Data Collecting
- Collecting Weather Data
- Collecting and Comparing Data
- Patterns Data Collecting
- Math Data Collecting
- Patterns, Data Collecting
- Collecting and Charting Data
- Patterns\, Data Collecting


