Curated OER
Evaluating Data
In this data worksheet, students learn how to organize the data collected during an experiment and practice finding patterns. Students graph a table of experimental data and complete 1 short answer question.
University of Georgia
Freezing and Melting of Water
Examine the behavior of energy as water freezes and melts. An engaging activity provides a hands-on experience to learners. Collaborative groups collect data and analyze the graphs of the temperature of water as it freezes and then...
Statistics Education Web
What Does the Normal Distribution Sound Like?
Groups collect data describing the number of times a bag of microwave popcorn pops at given intervals. Participants discover that the data fits a normal curve and answer questions based on the distribution of this data.
Curriculum Corner
Chrysanthemum: Name Graphing
Let's graph the amount of letters in everyone's name in the class. Give the two-page sheet to class members to collect letter data and then translate their data into a graph.
Curated OER
Data Lesson Vital Information
Students prepare and collect data and use excel and create a graph. They collect data about the number of pattern blocks that are put on tables. Students then record that data in Excel.
Curated OER
Collecting Data and Graphing
Young mathematicians collect data and graph it. They work collaboratively to collect data regarding the span of arm length versus height and graph the data they collect.
Curated OER
kind of Bean
Third graders sort different types of beans and collect the data. They create a data table, put the information on the data table and then graph their results. They answer follow-up questions.
Curated OER
Can You Count on Cans?
How can a canned food drive be connected to math? It's as simple as counting and organizing the cans! Children demonstrate their ability to sort non-perishable foods into categories that include soup cans, vegetable cans, boxed items,...
Curated OER
What's in a Graph?
Students explore how to use and interpret graphs. The graphs are pulled from a variety of sources, and the activities ask students to interpret graphs. They start this lesson with knowledge of what a graph is. Students also know how to...
Curated OER
Dealing With Data
Students collect, organize, and display data using a bar graph, line graph, pie graph, or picture graph. They write a summary describing the data represented and compare the graph to another graph in the class.
Curated OER
Student News And Weather Channel
Fabulous! Your 5th graders should love this project. As an ongoing lesson throughout the year students use temperature probes to record outside temperature and then document their data using spreadsheets. They use their weather data and...
Curated OER
Fish Communities in the Hudson
Learning to read data tables is an important skill. Use this resource for your third, fourth, or fifth graders. Learners will will study tables of fish collection data to draw conclusions. The data is based on fish environments in the...
Curated OER
Weather, Data, Graphs and Maps
Students collect data on the weather, graph and analyze it. In this algebra lesson, students interpret maps and are able to better plan their days based on the weather reading. They make predictions based on the type of clouds they see.
Curated OER
Linear Regression and Correlation
Learners explore scatter plots. In this linear regression lesson, groups of pupils graph scatter plots and then find the line of best fit. They identify outliers and explain the correlation. Each group summarizes and shares their...
Curated OER
Pet Tally
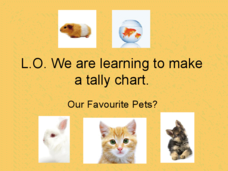
Give the class an opportunity to practice using tally marks as a way to collect data. As you progress through the slide show, learners tally up the number and types of pets they see, they then use their data to create a tally chart....
NOAA
History's Thermometers
How is sea coral like a thermometer? Part three of a six-part series from NOAA describes how oceanographers can use coral growth to estimate water temperature over time. Life science pupils manipulate data to determine the age of corals...
US Department of Energy
Thermal Expansion of Water: Rise of Sea Level
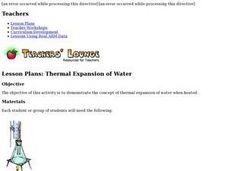
Using bunsen burners, Erlenmeyer flasks, thermometers, hollow glass tubes, stoppers, and rulers, learners experiment with and measure how water expands when heated. The activity connects the expansion of water when heated to global...
Curated OER
Obstacles to Success: Misleading Data
Eleventh graders explore how data reported by country agencies can mislead the public intentionally or unintentionally. In this Cross Curricular activity, 11th graders analyze charts and graphs in order to draw conclusions. Students...
Curated OER
Ornithology and Real World Science
Double click that mouse because you just found an amazing lesson! This cross-curricular Ornithology lesson incorporates literature, writing, reading informational text, data collection, scientific inquiry, Internet research, art, and...
Curated OER
Data Collection Graph
To be used however fits your needs most, this data collection graph includes spaces to chart a years worth of data. Print, keep handy, and fill out as the target skill is performed.
Curated OER
Graphs: All About Our Class
Students respond to survey questions, discuss results, brainstorm ways to represent survey information, and create table of class results. They find mean, range, and percentages, and create graph to display results.
Curated OER
Graphing Our Marbles
Students collect information pertaining to marble colors found in their bag; then creating a spreadsheet in order to make a chart representing their findings using Microsoft Excel. Students will present their results to small groups.
Curated OER
Make a Frequency Table and a Histogram for a Given Set of Data
In this data recording and data organization worksheet, students create one frequency table and one histogram for a given list of data. Explanations and examples for frequency tables and histograms are given.
Curated OER
Button Bonanza
Collections of data represented in stem and leaf plots are organized by young statisticians as they embark some math engaging activities.
Other popular searches
- Data Collection and Graphs
- Collect Data and Graphs
- Recording Data on Graphs
- Recording Data Into Graphs
- Data Collection Graphs


