Curated OER
TE Activity: A Tornado in My State?
Students study data about tornadoes in the United States while completing a worksheet. They develop a bar graph showing the number of tornadoes for the top ten states in the US. They find the median and mode of the data set.
Virginia Department of Education
Average Atomic Masses
Facilitate learning by using small objects to teach the principles of atomic mass in your science class. Pupils determine the average mass of varying beans as they perform a series of competitive experiments. They gather data and...
Virginia Department of Education
Scatterplots
Math is all fun and games with this activity! Learners use an activity designed around hula hoops to collect data. They create scatter plots with their data and then analyze the graphs for correlation.
PBS
Twirling in the Breeze
Blow classes away with a hands-on lesson investigating wind speed. Learners use common materials to design and construct anemometers. They then test their anemometers and collect data on the wind speed created by a fan.
University of Colorado
Using Spectral Data to Explore Saturn and Titan
Saturn's rings are made of dust, ice, and solid chunks of material. Individuals use spectrographs in this final installment of 22 lessons to determine the atmospheric elements. They analyze spectrums from Titan's atmosphere and Saturn's...
Cornell University
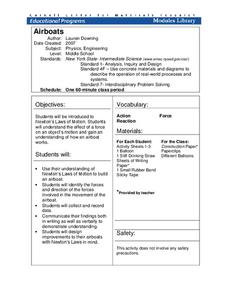
Airboats
Don't let the resource blow you away. Scholars build airboats from basic materials and collect data on how far the boats move. They refine their designs taking Newton's laws into consideration.
Curated OER
State Names: Frequency
Data grathers determine the frequency of specified data. They identify the frequency that specified letters occur in the names of all 50 states. They create stem-and-leaf plots, box-and-whisket plots and historgrams to illustrate the data.
Baylor College
Body Strength
Your young learners will discover how muscular strength and endurance can increase with this truly hands-on activity! Beginning by writing an acrostic for the word strength, class members then engage in tracking their ability to squeeze...
Curated OER
Representing Data 2: Using Box Plots
What information can be gleaned from a box and whiskers plot? Discuss the five summary values - minimum, maximum, upper and lower quartiles, and median - and what conclusions can be made from these values? Included here is a matching...
Curated OER
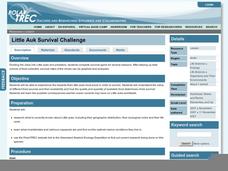
Little Auk Survival Challenge
A bird's life is one of danger and intrigue as it struggles for survival in sometimes harsh environments. To understand how difficult surviving in the wild can be, children play a simulation game where they act as little auks, birds from...
Institute of Electrical and Electronics Engineers
Smart Buildings and the Internet of Things
Is your building a smart building? Pupils learn what makes a building smart and about the internet of things. After viewing several videos on the topic, they conduct an activity collecting data from sensors and brainstorm ways to improve...
Council for Economic Education
Inflation Data: Is the Economy Healthy?
What stories do current trends tell about society, fashion, and the future? Scholars investigate the concept of inflation and its impact on the future of the American economy. They compile current economic data to determine the level of...
Curated OER
What's in a Graph?
How many yellow Skittles® come in a fun-size package? Use candy color data to construct a bar graph and a pie chart. Pupils analyze bar graphs of real-life data on the Texas and Massachusetts populations. As an assessment at the end of...
EngageNY
Margin of Error When Estimating a Population Proportion (part 1)
Use the power of mathematics to find the number of red chips in a bag — it's a little like magic! The activity asks learners to collect data to determine the percentage of red chips in a bag. They calculate the margin of error and...
Intel
What Does This Graph Tell You?
What can math say about natural phenomena? The fifth STEM lesson in this project-based learning series asks collaborative groups to choose a phenomenon of interest and design an experiment to simulate the phenomenon. After collecting...
Beyond Benign
Can You Hear Me Now? Cell Phone Accounts
How sustainable are cell phones? Throughout the unit, learners explore the issues around cell phones concerning sustainability. Class members take a graphical look at the number of cell phones across the world using a box-and-whisker...
NASA
Newton Car
If a car gets heavier, it goes farther? By running an activity several times, teams experience Newton's Second Law of Motion. The teams vary the amount of weight they catapult off a wooden block car and record the distance the car...
Pingry School
Effect of Solutes on Boiling Point
Anyone that lives around snow knows that adding salts to water increases its melting point. Are there solutes that affect the boiling point as well? A scientific experiment has learners add different solutes to water and then monitor the...
Curated OER
Representing Data 1: Using Frequency Graphs
Here is a lesson that focuses on the use of frequency graphs to identify a range of measures and makes sense of data in a real-world context as well as constructing frequency graphs given information about the mean, median, and range of...
Curated OER
Foliage Tracker
Young scholars discuss the change of leaf colors and the role that climate and elevation play in those changes. They then track leaf changes, input data, and graph foliage changes with a free online tool.
Pingry School
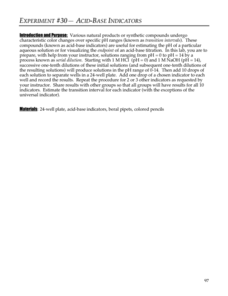
Acid-Base Indicators
Acid-base indicators are an essential part of any chemistry classroom. Individuals explore the color-changing feature of the important indicators in a vibrant hands-on activity. Using serial dilution, learners create solutions ranging...
Savvas Learning
Saxon Math 5/4
You'll never have to search for another worksheet again after downloading this extensive collection of Saxon math materials. With over 600 pages of example problems and skills practice exercises, this is a must-have resource for any...
US Department of Commerce
Exploring Sampling Variability - Higher Education Attainment Across The United States
More education in statistics is always beneficial. Given cards that provide the proportion of adults with bachelor's degrees in 10 random US states, scholars individually determine the sample percentage of states in which more than 30...
University of California
Seasons Lab Book
Unlock the mystery behind seasonal change with a collection of worksheets and activities. Whether they are drawing pictures of Earth's orbit around the sun or graphing the temperature and daylight hours of different locations from around...


