Curated OER
Why Are The Shore Birds Dying?
Learners engage in a field study of birds and how they are in danger harm due to environmental factors. They list different possible causes in a prediction activity. The observations are done while writing up data and connecting it to a...
Curated OER
What Does the Sun Give Us?
Pupils study the sun and how solar energy works. To learn about renewable energy, they complete a lab activity using a pizza box as a solar heater. Quite clever!
John Talavera
Autism iHelp – Sorting
Here is an app that will help kids sort objects! Sorting is an action that promotes cognitive flexibility and executive function. It is a key skill used in categorizing scientific data, making generalizations, and is foundational in...
Curated OER
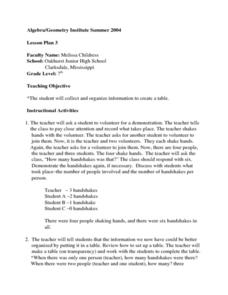
Creating a Data Table
Seventh graders explore organizing data into a table. The teacher leads a handshaking activity among the class. They collect the information concerning the number of handshakes each person received. Students discover a pattern. They...
Curated OER
Generating and Recording Data
Students demonstrate their ability to collect, organize, and display data. They examine everyday objects that can be turned into a function machine for the lesson plan. They use colored fish to help them organize their data.
Curated OER
Investigating: Interpreting Graphs and Analyzing Data
Students explore statistics by researching class birthday data. In this data analysis lesson, students investigate the different birthdays among their classmates and create data tables based on the given information. Students view bar...
Statistics Education Web
It’s Elemental! Sampling from the Periodic Table
How random is random? Demonstrate the different random sampling methods using a hands-on activity. Pupils use various sampling techniques to choose a random sample of elements from the periodic table. They use the different samples to...
Teach Engineering
What a Drag!
Stop and drop what is in your hand! Pupils investigate how form effects drag in the 12th part of a 22-part unit on aviation. Groups create equally weighted objects and determine which one falls the fastest by collecting data.
American Statistical Association
You and Michael
Investigate the relationship between height and arm span. Young statisticians measure the heights and arm spans of each class member and create a scatter plot using the data. They draw a line of best fit and use its slope to explain the...
Statistics Education Web
Who Sends the Most Text Messages?
The way you use statistics can tell different stories about the same set of data. Here, learners use sets of data to determine which person sends the most text messages. They use random sampling to collect their data and calculate a...
Space Awareness
The Thermal Layers of Oceans
How much does the sun heat up a lake or ocean? Scholars use a cup and a strong lamp to investigate the heat transfer and thermal layers in the ocean to come up with the answer. They collect data and graph it in order to better understand...
NASA
The Types of Clouds and What They Mean
Learn to forecast the weather using cloud types. Budding meteorologists identify cloud types and learn to use a dichotomous key. As scholars develop observation and identification skills, they discover how different cloud types cause...
University of Colorado
Happy Landings: A Splash or a Splat?
Huygens spacecraft landed on Saturn's moon Titan in 2005, making it the farthest landing from Earth ever made by a spacecraft. In this hands-on activity, the 12th installment of 22, groups explore how density affects speed. To do this,...
Statistics Education Web
Text Messaging is Time Consuming! What Gives?
The more you text, the less you study. Have classes test this hypothesis or another question related to text messages. Using real data, learners use technology to create a scatter plot and calculate a regression line. They create a dot...
Noyce Foundation
Granny’s Balloon Trip
Take flight with a fun activity focused on graphing data on a coordinate plane. As learners study the data for Granny's hot-air balloon trip, including the time of day and the distance of the balloon from the ground, they practice...
Virginia Department of Education
Line of Best Fit
Pupils work through a guided activity on fitting a linear equation to a set of data by entering the data into a calculator and trying to envision a line of best fit. They then have the calculator determine the least-squares line and...
EngageNY
Connecting Graphical Representations and Numerical Summaries
Which graph belongs to which summary statistics? Class members build upon their knowledge of data displays and numerical summaries to connect the two. Pupils make connections between different graphical displays of the same data in the...
Curated OER
Exploring Seasonal Shadows and Sunlight
What can shadows tell us about the changing season? Over several months, astronomy learners record length and position of an outdoor object's shadow, such as a flagpole. They apply the data to a growing hypothesis and note the patterns...
Radford University
Connecting Scatter Plots and Correlation Coefficients Activity
Collect a variety of bivariate data. Groups determine sets of data that would provide a positive, negative, and no correlation. Team members gather their data through out the week. Scholars plot the data and determine the relationship...
EngageNY
Differences Due to Random Assignment Alone
It takes a lot of planning to achieve a random result! Learners compare results of random assignment, and conclude that random assignment allows results to be attributed to chance. They also realize the set of random means are clustered...
Pace University
Grade 7 Earth Day Statistics with Circle and Bar Graphs
Take a tiered approach to studying waste. The lesson uses Earth Day to present differentiated instruction around using circle and bar graphs. Each group gets a cube based on their tiers and works collaboratively as well as individually...
Bonneville
Solar Powered Water Pumping
Here's the perfect lesson for those who think the world needs faster pumps. Building on the previous activity, scholars work to make the pumps function faster in transferring water between containers. They try adding an additional solar...
Georgetown University
Cup-Activity: Writing Equations From Data
Determine how cup stacking relates to linear equations. Pupils stack cups and record the heights. Using the data collected, learners develop a linear equation that models the height. The scholars then interpret the slope and the...
Chicago Children's Museum
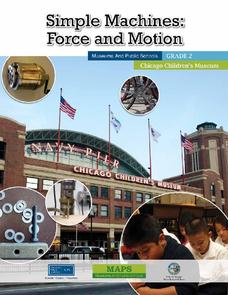
Simple Machines: Force and Motion
Get things moving with this elementary science unit on simple machines. Through a series of nine lessons including teacher demonstrations, hands-on activities, and science experiments, young scientists learn about forces, motion, and...


