Teach Engineering
A Good Foundation
It takes a strong foundation to build a house and a stronger one for a bridge. This resource presents the effects of geology and soil on bridge foundations. Working in groups, the class investigates the interaction of shallow and deep...
Chicago Botanic Garden
GEEBITT (Global Equilibrium Energy Balance Interactive TinkerToy)
Students use the GEEBITT excel model to explore how global average temperatures are affected by changes in our atmosphere in part two of this series of seven lessons. Working in groups, they discuss, analyze graphs, and enter data to...
Smithsonian Institution
Trait Tracker
Help mice beat the odds with an exciting activity about traits. Biologists discover the role of diet and other factors on animal traits by participating in a simulation activity. Teams collect and evaluate data to understand how certain...
Actis
Handling Data: Probability, Tree Diagrams
Clean, but captivating, two online simulations demonstrate probability for middle schoolers. They can choose the number of coins and tosses and watch as the results pile up. They can choose from a variety of spinner types and the number...
NOAA
Importance of Deep-Sea Ecosystems – How Diverse is That?
When judging diversity of an ecosystem, both species evenness and species richness must contribute. After a discussion of diversity and a guided example using the Shannon-Weaver function, scholars use the same function on two other...
Smithsonian Institution
Weather Widget
What's so difficult about predicting the weather? Scholars work collaboratively to build a device that models how meteorologists use computers to forecast weather. Team members collect and interpret data while working together to...
Baylor College
Energy for Life (Energy from Food)
Energy comes in many forms, but how do living things get the energy they need to survive and thrive? In a simple, controlled experiment with yeast, water, and sugar, groups make observations about how yeast reacts with water alone, then...
Prince William Network
Migration Math Madness
A great way to incorporate math into life science, this lesson has learners measure migratory routes on a map and calculate the actual distance that shorebirds on the routes would cover. Learners compute the distance covered in both...
Museum of Tolerance
And Justice for All? Slavery Not Just in the Past
Slavery in India, Sudan, and Mauritania? What about in the United States? Groups research modern slavery in these four countries, collecting factual evidence (What), determine their feelings about this evidence (So what), and consider...
LABScI
Taxonomy: Who is in My family?
Find similarities in seemingly unlike organisms. The second instructional activity in a series of 12 builds the concept of a taxonomy and explores the use of a dichotomous key. Learners begin in part one by attempting to group a set of...
National Wildlife Federation
Watershed Web: A Field Trip
Observing plant succession doesn't have to be a decade long process. A hands-on instructional activity has groups study succession over a designated space. Learners use their observation skills to record differences in plant and soil...
Kenan Fellows
Effects of a Golf Course on Stream Health
Is the golf course causing issues in the stream? Find out with a resource that has groups perform chemical water tests to analyze the effects of a golf course on a stream. Pupils collect water above and below the course and analyze the...
Curated OER
Graphing Memories
Mem Fox’s Wilfrid Gordon McDonald Partridge provides the labels for a graphing activity. Class members create an illustration of a memory item brought from home, and place their illustration in the proper column of a graph. When the...
Curated OER
Energy Saving activities Lighting
Eighth graders study how light emits energy. In this energy savings lesson, 8th graders conduct two experiments to find ways to save energy. In one experiment students measure the light in each classroom and make recommendations for...
Curated OER
Slip Slide'n Away
Students analyze the sliding of boxes along a warehouse floor. In this algebra lesson, students connect math and physics by calculating the friction created by the sliding of each box. They develop faster method to move the box, based on...
Curated OER
Saving Energy Through Ecological Landscape Design
Students are able to transcribe to scale the plant features of a common landscape. They determine true north and south and collect and record data on a table. Students calculate a rating for and describe a definition of insulation and...
Curated OER
Embracing Diversity
Students explore and use different computer programs for collecting data. In this technology based lesson, students set up a survey and use the Excel and Lotus software to collect data.
Curated OER
Confidence Levels
Learners collect data and graph it. In this statistics lesson, students rate confidence levels by collecting data and analyzing it. They graph their findings on the Ti calculator.
Curated OER
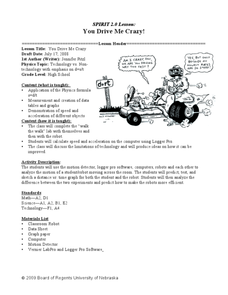
You Drive Me crazy
Students calculate the distance and acceleration of an object. In this algebra lesson, students collect data and create table and graphs to analyze it. They complete a lab as they collect and analyze data on acceleration and distance.
Curated OER
Investing
Students collect data on investments and draw conclusions. In this algebra lesson, students analyze exponential graphs as they relate to money. They discuss the cause of an account balance being high or low.
Curated OER
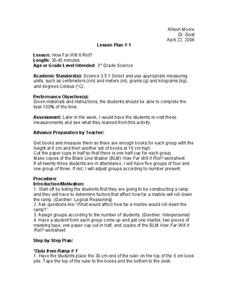
How Far Will It Roll?
Third graders investigate physics by conducting an experiment. In this gravity lesson, 3rd graders create a ramp using books and paper which they roll a marble down. Students utilize the scientific method to predict and record data...
Curated OER
Riding on a Pendulum
A comprehensive resource gets fourth grade physical scientists making observations about the period of a pendulum and then applying knowledge to a playground swing. Through seven different stations, they will record observations and...
Curated OER
Quadratic Equations with the CBL 2
Learners practice generating parabolas with a motion sensor while determining the vertex form of the equation. They compare it to the regression equation from the calculator onto a data mate software. Each student completes several...
Center Science Education
Plugged In To CO2
Watt is going on here? Middle schoolers are learning about energy use and carbon dioxide emissions! In the first part of this lesson, learners measure how much energy different appliances consume and calculate the amount per day. In the...


