Curated OER
Ice Cream Lab
I scream, you scream, we all scream for ice cream! Even high schoolers enjoy making ice cream. This laboratory exercise has them record the temperature changes throughout the process of liquid becoming solid, graph the results, and...
Curated OER
A Journey with a Scientist
Students work in groups as they read chapters of Charles Darwin's, Voyage of the Beagle. They take notes on the chapter and in their group make a timeline of the chapter. They tape the timelines together in order to depict the entire...
Math Worksheets Land
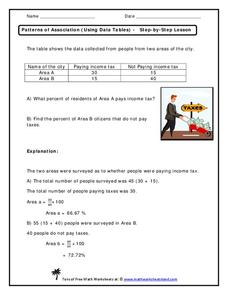
Patterns of Association (Using Data Tables) - Step-by-Step Lesson
This worksheet belongs to a four-part resource that gathers information from data tables to calculate percentages. The page introduces one problem and shares an explanation to the answer.
Kenan Fellows
Sensors in Chemistry
The Environmental Protection Agency monitors sensors to track air pollution and set clean air standards. Enthusiastic young scientists use similar sensors to gather data in their area and then apply the gas laws and conservation of...
CPO Science
Physics Skill and Practice Worksheets
Stop wasting energy searching for physics resources, this comprehensive collection of worksheets has you covered. Starting with introductions to the scientific method, dimensional analysis, and graphing data, these skills practice...
Curated OER
Graphing with Stems-and -Leafs
Fourth graders examine the use of stem and leaf graphs. For this stem and leaf graph lesson, 4th graders participate in teacher led lesson showing the use of the graphs. They work in groups to collect data about peanuts before making a...
Curated OER
Planning a Trip
Students collect data, organize data, and compute differences of multi-digit numbers. In this data analysis lesson, students put together their best travel plan in small groups as outlined in the first lesson. Students study a map,...
Curated OER
Dealing with Data in Elementary School
Students follow the scientific method in collecting data. In this following the scientific method in collecting data instructional activity, students develop a question they would like answered such as how many aluminum cans are consumed...
Curated OER
What Color Are Your Skittles?
Students create spreadsheets and manipulate data. They collect data, create appropriate graphs and use percentages to describe quantities. Students compare and contrast data. They use spreadsheets to generate a pie chart.
Curated OER
Venn Diagrams
Young scholars collect and display data in a Venn Diagram. In this statistics lesson, students collect data, compare the data and make inferences about their data. They use the Venn diagrams to identify what the data have in common and...
Curated OER
Graphing the Forecast-Line Graph or Bar Graph?
Learners explore bar and line graphs. In this data collection, graphing, and weather lesson, students compare bar and line graphs and discuss which type of graph would be most appropriate for displaying a ten day weather forecast....
Curated OER
How Many People Live in Your Household?
Students create a pictograph showing household size for the class.In this data collection and graphing lesson, the teacher guides students through the creation of a concrete object graph, then students analyze and summarize the results.
Curated OER
Estimation and Your TV Diet
Students develop estimation skills by using real life situations. For this estimation lesson students collect data about their television watching habits. They make hypothesis about the number of hours they watch, how many commercials,...
Curated OER
Reading the Neighborhood
First graders complete activities with the story One Monday Morning in the Macmillan/McGraw Hill Textbook. In this data lesson, 1st graders read the story and gather data to create a picture graph. They read the graph and answer...
National Council of Teachers of Mathematics
Varying Motion
For this secondary mathematics learning exercise, high schoolers collect data based on a person’s motion. From this data, students create graphs comparing displacement, velocity, and acceleration to time. The five-page learning exercise...
Curated OER
Valentine Candy Count
Students analyze a bag of Valentine candy to create a graph. In this graphing lesson, students make predictions, sort by color, record data and make a graph. Students discuss results and make generalizations. Students generate their own...
Curated OER
Hands on Habitat
Students teach others about habitats. In this Science lesson, students use a Science Log to record data about a habitat for research. Students analyze the data and construct an eco-chamber. Students share what they have found with other...
Curated OER
Flicking Football Fun
Young mathematicians fold and flick their way to a deeper understanding of statistics with a fun, hands-on math unit. Over the course of four lessons, students use paper footballs to generate data as they learn how to create line...
NOAA
Tracking a Drifter
Be shore to use this drifter resource. The third installment of a five-part series has learners using the NOAA's Adopt-a-Drifter website to track to movement of a drifter (buoy) in the ocean. Graphing the collected data on a map allows...
American Statistical Association
How Long is 30 Seconds?
Is time on your side? Pupils come up with an experiment to test whether their classmates can guess how long it takes for 30 seconds to elapse. They divide the class data into two groups, create box-and-whisker plots, and analyze the...
Curated OER
A Day at the Beach
Let's go to the beach! Danielle, Marty, and Phil collected shells at the beach. Can you determine how many shells each child has? Create a picture graph to make the data easier to understand.
American Statistical Association
Step into Statastics
Class members study the size of classmates' feet and perform a statistical analysis of their data. They solve for central tendencies, quartiles, and spread for the entire group as well as subgroups. They then write a conclusion based on...
Radford University
A Change in the Weather
Explore the power of mathematics through this two-week statistics unit. Pupils learn about several climate-related issues and complete surveys that communicate their perceptions. They graph both univariate and bivariate data and use...
Curated OER
Graph It!
There is more than one way to represent data! Learners explore ways to represent data. They examine stacked graphs, histograms, and line plots. They conduct surveys and use stacked graphs, histograms, or line plots to chart the data they...
Other popular searches
- Collect and Organize Data
- Data Collecting
- Data Sets Data Collection
- Collecting and Organizing Data
- Collection of Data
- Data Collections
- Collect and Analyze Data
- Collect and Classify Data
- Collecting and Using Data
- Collect and Organise Data
- Leaf Collection Data
- Games on Data Collecting


